3 6 12 UNEMPLOYMENT RATE (Percent) 9 15 18 ollowing statements are true based on these graphs? Check all that apply. natural level of output is $3 trillion. unemployment rate is currently 9% higher than the natural rate of unemployment. current quantity of output is greater than potential output. central bank of the economy decreases the money supply.
3 6 12 UNEMPLOYMENT RATE (Percent) 9 15 18 ollowing statements are true based on these graphs? Check all that apply. natural level of output is $3 trillion. unemployment rate is currently 9% higher than the natural rate of unemployment. current quantity of output is greater than potential output. central bank of the economy decreases the money supply.

Chapter14: Aggregate Demand And Supply
Section: Chapter Questions
Problem 10SQP

Related questions

Question
Transcribed Image Text:INFLATION F
0
3 6
12
UNEMPLOYMENT RATE (Percent)
9
15
SRPC
18
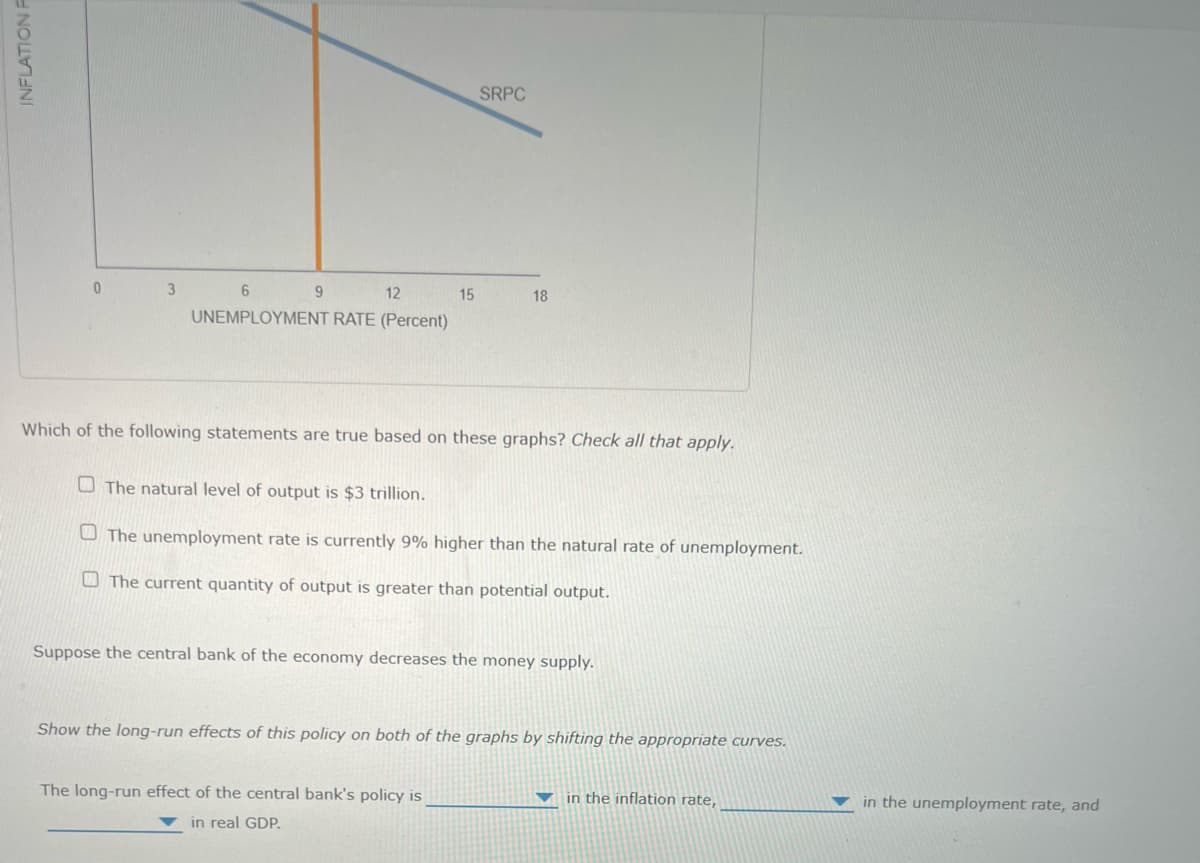
Which of the following statements are true based on these graphs? Check all that apply.
The natural level of output is $3 trillion.
The unemployment rate is currently 9% higher than the natural rate of unemployment.
The current quantity of output is greater than potential output.
The long-run effect of the central bank's policy is
in real GDP.
Suppose the central bank of the economy decreases the money supply.
Show the long-run effects of this policy on both of the graphs by shifting the appropriate curves.
in the inflation rate,
in the unemployment rate, and
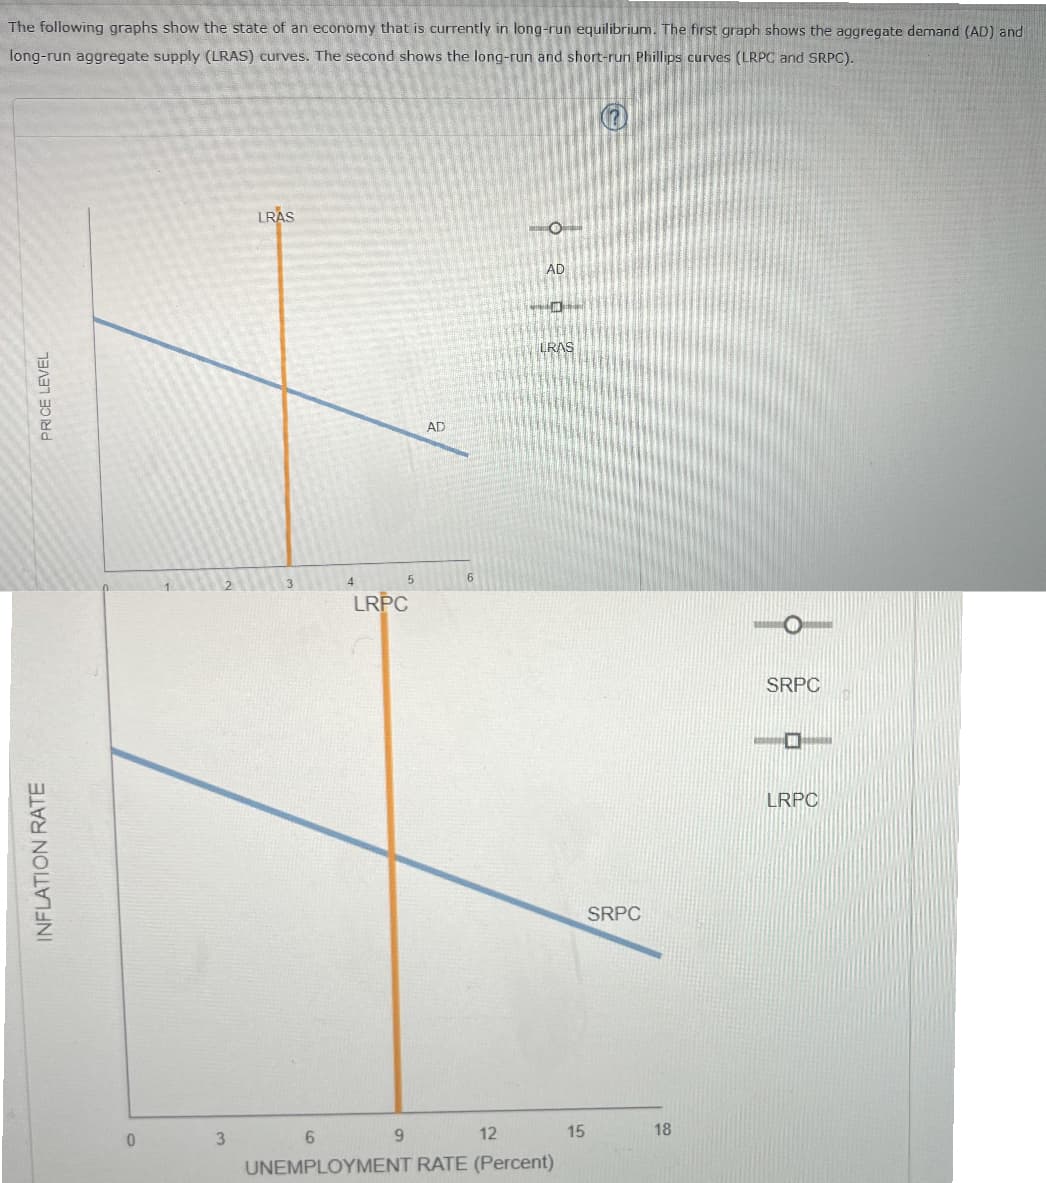
Transcribed Image Text:The following graphs show the state of an economy that is currently in long-run equilibrium. The first graph shows the aggregate demand (AD) and
long-run aggregate supply (LRAS) curves. The second shows the long-run and short-run Phillips curves (LRPC and SRPC).
PRICE LEVEL
INFLATION RATE
0
3
LRAS
4
5
LRPC
9
AD
O
AD
LRAS
6
12
UNEMPLOYMENT RATE (Percent)
15
SRPC
18
Ⓒ
SRPC
-
LRPC
Expert Solution
This question has been solved!
Explore an expertly crafted, step-by-step solution for a thorough understanding of key concepts.

This is a popular solution!

Trending now
This is a popular solution!

Step by step
Solved in 3 steps with 2 images

Knowledge Booster


Learn more about
Need a deep-dive on the concept behind this application? Look no further. Learn more about this topic, economics and related others by exploring similar questions and additional content below.Recommended textbooks for you

Brief Principles of Macroeconomics (MindTap Cours…
Economics
ISBN:
9781337091985
Author:
N. Gregory Mankiw
Publisher:
Cengage Learning

Brief Principles of Macroeconomics (MindTap Cours…
Economics
ISBN:
9781337091985
Author:
N. Gregory Mankiw
Publisher:
Cengage Learning


Exploring Economics
Economics
ISBN:
9781544336329
Author:
Robert L. Sexton
Publisher:
SAGE Publications, Inc
