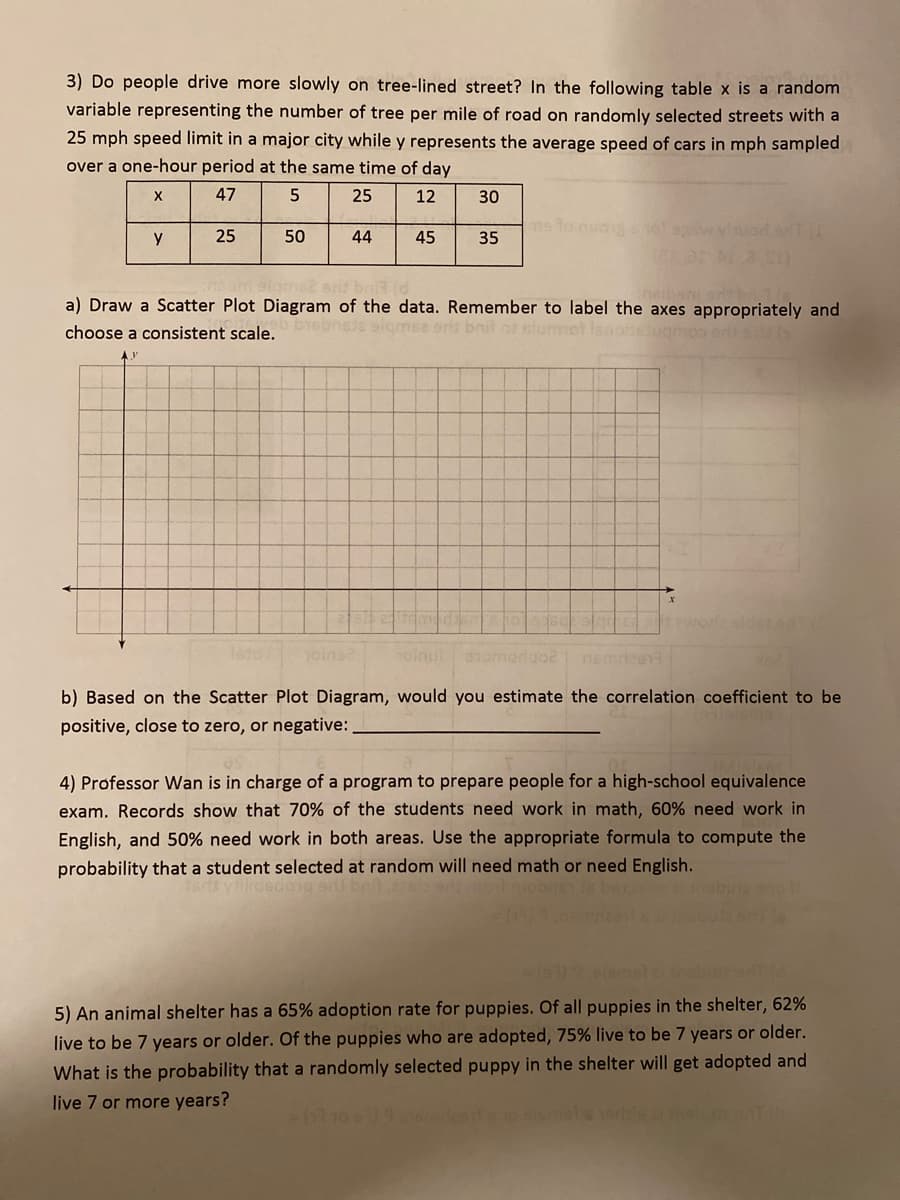
3) Do people drive more slowly on tree-lined street? In the following table x is a random variable representing the number of tree per mile of road on randomly selected streets with a 25 mph speed limit in a major city while y represents the average speed of cars in mph sampled over a one-hour period at the same time of day 47 25 12 30 me to nuo 35 y 25 50 44 45
3) Do people drive more slowly on tree-lined street? In the following table x is a random variable representing the number of tree per mile of road on randomly selected streets with a 25 mph speed limit in a major city while y represents the average speed of cars in mph sampled over a one-hour period at the same time of day 47 25 12 30 me to nuo 35 y 25 50 44 45

Glencoe Algebra 1, Student Edition, 9780079039897, 0079039898, 2018
18th Edition
ISBN:9780079039897
Author:Carter
Publisher:Carter
Chapter10: Statistics
Section10.3: Measures Of Spread
Problem 1GP

Related questions

Topic Video
Question
Transcribed Image Text:3) Do people drive more slowly on tree-lined street? In the following table x is a random
variable representing the number of tree per mile of road on randomly selected streets with a
25 mph speed limit in a major city while y represents the average speed of cars in mph sampled
over a one-hour period at the same time of day
47
25
12
30
me to que
35
y
25
50
44
45
ent brit (d
a) Draw a Scatter Plot Diagram of the data. Remember to label the axes appropriately and
nsbnee sigmse eris bnit or slummot
choose a consistent scale.
cins2
oinutonomodgo2
nemdeent
b) Based on the Scatter Plot Diagram, would you estimate the correlation coefficient to be
positive, close to zero, or negative:
4) Professor Wan is in charge of a program to prepare people for a high-school equivalence
exam. Records show that 70% of the students need work in math, 60% need work in
English, and 50% need work in both areas. Use the appropriate formula to compute the
probability that a student selected at random will need math or need English.
yiidsdong er
5) An animal shelter has a 65% adoption rate for puppies. Of all puppies in the shelter, 62%
live to be 7 years or older. Of the puppies who are adopted, 75% live to be 7 years or older.
What is the probability that a randomly selected puppy in the shelter will get adopted and
live 7 or more years?
( 10)9 des
Expert Solution
This question has been solved!
Explore an expertly crafted, step-by-step solution for a thorough understanding of key concepts.

This is a popular solution!

Trending now
This is a popular solution!

Step by step
Solved in 2 steps with 1 images

Knowledge Booster


Learn more about
Need a deep-dive on the concept behind this application? Look no further. Learn more about this topic, statistics and related others by exploring similar questions and additional content below.Recommended textbooks for you
Glencoe Algebra 1, Student Edition, 9780079039897…
Algebra
ISBN:
9780079039897
Author:
Carter
Publisher:
McGraw Hill
Glencoe Algebra 1, Student Edition, 9780079039897…
Algebra
ISBN:
9780079039897
Author:
Carter
Publisher:
McGraw Hill