3) The cyclical pattern of symptoms is sinusoidal in nature. When graphed as a function of intensity, g(x), and time, x in months, the function was very similar to S(x) = sin x Dr. Andersen described shape of this graph, with reference to S(x) = sin x Intensity is ranked on a scale of 0-10, where zero represents normal and ten represents full blown symptoms. The amplitude of the cyclical pattern is 5 and the equation of the axis of the curve is =5. The period of the function is 4 months. Using (x) = sin .x as a base function, the symptoms function has been horizontally translated 2 months to the right. a) Write a possible equation for the function g(x) b) Sketch a graph of the function 8(x) , by hand, on the interval 0sxs18 .
3) The cyclical pattern of symptoms is sinusoidal in nature. When graphed as a function of intensity, g(x), and time, x in months, the function was very similar to S(x) = sin x Dr. Andersen described shape of this graph, with reference to S(x) = sin x Intensity is ranked on a scale of 0-10, where zero represents normal and ten represents full blown symptoms. The amplitude of the cyclical pattern is 5 and the equation of the axis of the curve is =5. The period of the function is 4 months. Using (x) = sin .x as a base function, the symptoms function has been horizontally translated 2 months to the right. a) Write a possible equation for the function g(x) b) Sketch a graph of the function 8(x) , by hand, on the interval 0sxs18 .

Trigonometry (MindTap Course List)
8th Edition
ISBN:9781305652224
Author:Charles P. McKeague, Mark D. Turner
Publisher:Charles P. McKeague, Mark D. Turner
Chapter3: Radian Measure
Section3.5: Velocities
Problem 54PS: Velocity of a Ferris Wheel Use Figure 7 as a model of the Ferris wheel called Colossus that is built...

Related questions
Topic Video
Question
The question is in the image
Transcribed Image Text:Question
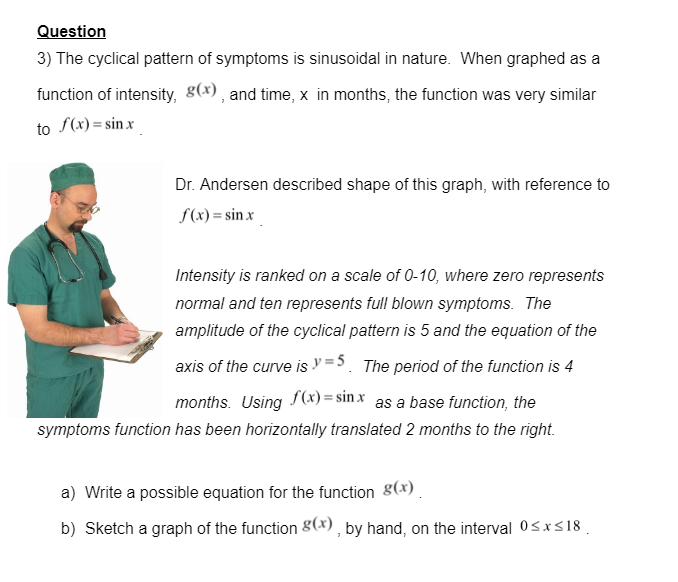
3) The cyclical pattern of symptoms is sinusoidal in nature. When graphed as a
function of intensity, g(x) , and time, x in months, the function was very similar
to S(x)= sin x
Dr. Andersen described shape of this graph, with reference to
S(x) = sin x
Intensity is ranked on a scale of 0-10, where zero represents
normal and ten represents full blown symptoms. The
amplitude of the cyclical pattern is 5 and the equation of the
axis of the curve is =5. The period of the function is 4
months. Using f(x) = sin x as a base function, the
symptoms function has been horizontally translated 2 months to the right.
a) Write a possible equation for the function 8(x)
b) Sketch a graph of the function 8(x), by hand, on the interval 0<x<18 .
Expert Solution
This question has been solved!
Explore an expertly crafted, step-by-step solution for a thorough understanding of key concepts.

This is a popular solution!

Trending now
This is a popular solution!

Step by step
Solved in 4 steps with 1 images

Knowledge Booster


Learn more about
Need a deep-dive on the concept behind this application? Look no further. Learn more about this topic, advanced-math and related others by exploring similar questions and additional content below.Recommended textbooks for you
Trigonometry (MindTap Course List)
Trigonometry
ISBN:
9781305652224
Author:
Charles P. McKeague, Mark D. Turner
Publisher:
Cengage Learning

Algebra & Trigonometry with Analytic Geometry
Algebra
ISBN:
9781133382119
Author:
Swokowski
Publisher:
Cengage
Trigonometry (MindTap Course List)
Trigonometry
ISBN:
9781305652224
Author:
Charles P. McKeague, Mark D. Turner
Publisher:
Cengage Learning
Algebra & Trigonometry with Analytic Geometry
Algebra
ISBN:
9781133382119
Author:
Swokowski
Publisher:
Cengage