3. A study of beer consumption using the annual data from 1980 -2001 produced the following regression: Y = 0.41 +0.052.X₁ -0.047X2; +0.032X3; -0.018.X4i (0.027) (0.011) (0.009) (0.008) (0.009) R² = 0.94 F = 66.58 DW statistic = 1.32, figures in the brackets are standard errors Where: Y₁ = Annual aggregate beer consumption in year t (billion pints) X₁i = Real disposable income income in year t ($ billions at 2001 prices) X2i = Price of beer in year t (index number with 2001 = 100) X3₁ = Price of wine and sprits in year t (index number with 2001 = 100) X4₁ = Price of cigarettes in year t (index number 2001 = 100) (a) What is the effect of a change in the price of beer on beer consumption? Does it have the correct sign? Explain. (b) Comment on the signs of the other three coefficients. Are they as expected? (c) Tests the significance of the coefficients on each of the variables Xit i = 1, 2, 3, 4. What assumptions have you made in carrying out these tests? (d) What conclusion do you draw from the value of the Durbin-Watson statistic? Do your conclusions alter your answer to (c) ?
3. A study of beer consumption using the annual data from 1980 -2001 produced the following regression: Y = 0.41 +0.052.X₁ -0.047X2; +0.032X3; -0.018.X4i (0.027) (0.011) (0.009) (0.008) (0.009) R² = 0.94 F = 66.58 DW statistic = 1.32, figures in the brackets are standard errors Where: Y₁ = Annual aggregate beer consumption in year t (billion pints) X₁i = Real disposable income income in year t ($ billions at 2001 prices) X2i = Price of beer in year t (index number with 2001 = 100) X3₁ = Price of wine and sprits in year t (index number with 2001 = 100) X4₁ = Price of cigarettes in year t (index number 2001 = 100) (a) What is the effect of a change in the price of beer on beer consumption? Does it have the correct sign? Explain. (b) Comment on the signs of the other three coefficients. Are they as expected? (c) Tests the significance of the coefficients on each of the variables Xit i = 1, 2, 3, 4. What assumptions have you made in carrying out these tests? (d) What conclusion do you draw from the value of the Durbin-Watson statistic? Do your conclusions alter your answer to (c) ?

Chapter4: Linear Functions
Section4.3: Fitting Linear Models To Data
Problem 34SE: For the following exercises, consider this scenario: The profit of a company decreased steadily...

Related questions
Question
100%
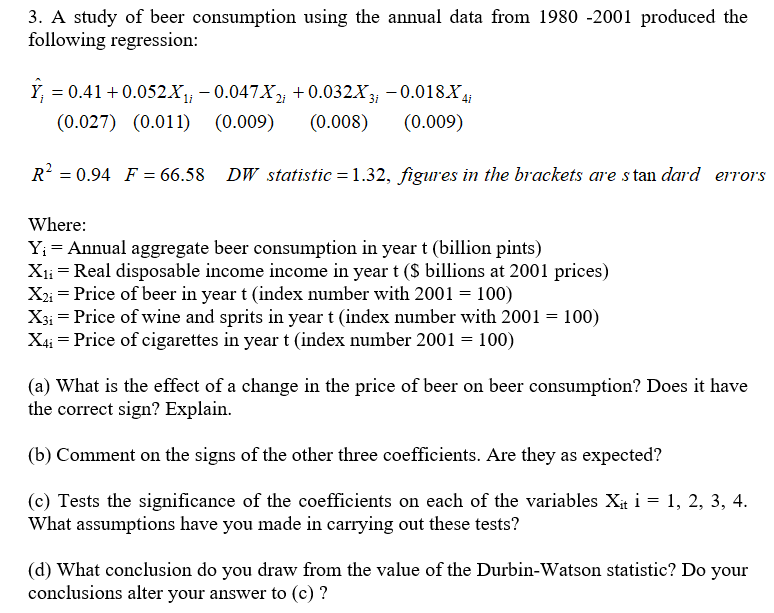
Transcribed Image Text:3. A study of beer consumption using the annual data from 1980 -2001 produced the
following regression:
Y = 0.41 +0.052.X₁; −0.047X2; +0.032X3; −0.018X4i
(0.027) (0.011) (0.009) (0.008) (0.009)
R² = 0.94 F = 66.58 DW statistic=1.32, figures in the brackets are standard errors
Where:
Y₁ = Annual aggregate beer consumption in year t (billion pints)
X₁₁ = Real disposable income income in year t ($ billions at 2001 prices)
X2i = Price of beer in year t (index number with 2001 = 100)
X31 Price of wine and sprits in year t (index number with 2001 = 100)
=
X4₁ = Price of cigarettes in year t (index number 2001 = 100)
(a) What is the effect of a change in the price of beer on beer consumption? Does it have
the correct sign? Explain.
(b) Comment on the signs of the other three coefficients. Are they as expected?
(c) Tests the significance of the coefficients on each of the variables Xit i = 1, 2, 3, 4.
What assumptions have you made in carrying out these tests?
(d) What conclusion do you draw from the value of the Durbin-Watson statistic? Do your
conclusions alter your answer to (c) ?
Expert Solution
This question has been solved!
Explore an expertly crafted, step-by-step solution for a thorough understanding of key concepts.

Step by step
Solved in 4 steps

Recommended textbooks for you

College Algebra
Algebra
ISBN:
9781305115545
Author:
James Stewart, Lothar Redlin, Saleem Watson
Publisher:
Cengage Learning

Linear Algebra: A Modern Introduction
Algebra
ISBN:
9781285463247
Author:
David Poole
Publisher:
Cengage Learning
College Algebra
Algebra
ISBN:
9781305115545
Author:
James Stewart, Lothar Redlin, Saleem Watson
Publisher:
Cengage Learning
Linear Algebra: A Modern Introduction
Algebra
ISBN:
9781285463247
Author:
David Poole
Publisher:
Cengage Learning

Algebra & Trigonometry with Analytic Geometry
Algebra
ISBN:
9781133382119
Author:
Swokowski
Publisher:
Cengage

Algebra and Trigonometry (MindTap Course List)
Algebra
ISBN:
9781305071742
Author:
James Stewart, Lothar Redlin, Saleem Watson
Publisher:
Cengage Learning

Functions and Change: A Modeling Approach to Coll…
Algebra
ISBN:
9781337111348
Author:
Bruce Crauder, Benny Evans, Alan Noell
Publisher:
Cengage Learning