Group Median (denoted by x) To compute for the group median, we make another column for the "cf" which is read as "less than cumulative frequency" or simply "cumulative frequency". Each entry in "cf" column is obtained by adding the frequencies starting from the lowest class interval. Class Tally Frequency Class Mark cf Boundaries 10-16 /////-/11 8 13 8 16-22 //// 4 19 12 Median Class since n 24 22-28 11 2 25 14 12 22 28-34 ///// 5 31 19 34-40 3 37 22 40-46 // 2 43 24 n = 24 The position of the median is then determined by where n is the number of observations. The median class is the class that contains the median. The formula for the group median is below: -cfb x=Lm +11 where: Lu is the lower class boundary of the median class 71 is the total number of observations or sample size cfn is the less than cumulative frequency of the class before the median class is the frequency of the median class fm L is the class width Given the frequency distribution above, compute the group median: To begin, determine the values of the following and then substitute to the formula: L₁= 11=== cf= /=
Group Median (denoted by x) To compute for the group median, we make another column for the "cf" which is read as "less than cumulative frequency" or simply "cumulative frequency". Each entry in "cf" column is obtained by adding the frequencies starting from the lowest class interval. Class Tally Frequency Class Mark cf Boundaries 10-16 /////-/11 8 13 8 16-22 //// 4 19 12 Median Class since n 24 22-28 11 2 25 14 12 22 28-34 ///// 5 31 19 34-40 3 37 22 40-46 // 2 43 24 n = 24 The position of the median is then determined by where n is the number of observations. The median class is the class that contains the median. The formula for the group median is below: -cfb x=Lm +11 where: Lu is the lower class boundary of the median class 71 is the total number of observations or sample size cfn is the less than cumulative frequency of the class before the median class is the frequency of the median class fm L is the class width Given the frequency distribution above, compute the group median: To begin, determine the values of the following and then substitute to the formula: L₁= 11=== cf= /=

MATLAB: An Introduction with Applications
6th Edition
ISBN:9781119256830
Author:Amos Gilat
Publisher:Amos Gilat
Chapter1: Starting With Matlab
Section: Chapter Questions
Problem 1P

Related questions
Question
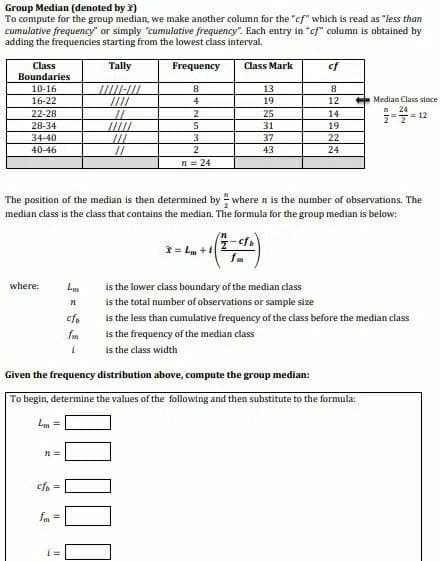
Transcribed Image Text:Group Median (denoted by X)
To compute for the group median, we make another column for the "cf" which is read as "less than
cumulative frequency or simply "cumulative frequency". Each entry in "cf" column is obtained by
adding the frequencies starting from the lowest class interval.
Class
Tally
Frequency
Class Mark
cf
Boundaries
10-16
///-//
8
13
8
16-22
////
4
19
12
Median Class since
22-28
//
2
25
14
12
28-34
5
31
19
34-40
///
3
37
22
40-46
//
2
43
24
n = 24
The position of the median is then determined by where n is the number of observations. The
median class is the class that contains the median. The formula for the group median is below:
x=Lm +1
where:
L
is the lower class boundary of the median class
71
is the total number of observations or sample size
cfb
is the less than cumulative frequency of the class before the median class
is the frequency of the median class
fm
L
is the class width
Given the frequency distribution above, compute the group median:
To begin, determine the values of the following and then substitute to the formula:
L₁ =
n =
cfb=
fm =
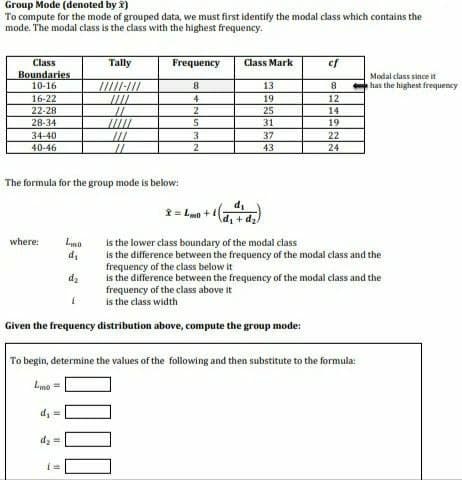
Transcribed Image Text:Group Mode (denoted by 2)
To compute for the mode of grouped data, we must first identify the modal class which contains the
mode. The modal class is the class with the highest frequency.
Tally
Frequency
Class Mark
cf
Class
Boundaries
Modal class since it
has the highest frequency
10-16
/////-///
8
13
8
16-22
III/
4
19
12
22-28
11
2
25
14
28-34
/////
31
19
34-40
111
37
22
40-46
43
24
The formula for the group mode is below:
2= 40 +
d₁ + d₂
where:
Lo
is the lower class boundary of the modal class
d₁
is the difference between the frequency of the modal class and the
frequency of the class below it
d₂
is the difference between the frequency of the modal class and the
frequency of the class above it
{
is the class width
Given the frequency distribution above, compute the group mode:
To begin, determine the values of the following and then substitute to the formula:
Limo=
d₁ =
i=
5
3
2
Expert Solution
This question has been solved!
Explore an expertly crafted, step-by-step solution for a thorough understanding of key concepts.

Step by step
Solved in 3 steps

Recommended textbooks for you
MATLAB: An Introduction with Applications
Statistics
ISBN:
9781119256830
Author:
Amos Gilat
Publisher:
John Wiley & Sons Inc

Probability and Statistics for Engineering and th…
Statistics
ISBN:
9781305251809
Author:
Jay L. Devore
Publisher:
Cengage Learning

Statistics for The Behavioral Sciences (MindTap C…
Statistics
ISBN:
9781305504912
Author:
Frederick J Gravetter, Larry B. Wallnau
Publisher:
Cengage Learning
MATLAB: An Introduction with Applications
Statistics
ISBN:
9781119256830
Author:
Amos Gilat
Publisher:
John Wiley & Sons Inc
Probability and Statistics for Engineering and th…
Statistics
ISBN:
9781305251809
Author:
Jay L. Devore
Publisher:
Cengage Learning
Statistics for The Behavioral Sciences (MindTap C…
Statistics
ISBN:
9781305504912
Author:
Frederick J Gravetter, Larry B. Wallnau
Publisher:
Cengage Learning

Elementary Statistics: Picturing the World (7th E…
Statistics
ISBN:
9780134683416
Author:
Ron Larson, Betsy Farber
Publisher:
PEARSON

The Basic Practice of Statistics
Statistics
ISBN:
9781319042578
Author:
David S. Moore, William I. Notz, Michael A. Fligner
Publisher:
W. H. Freeman

Introduction to the Practice of Statistics
Statistics
ISBN:
9781319013387
Author:
David S. Moore, George P. McCabe, Bruce A. Craig
Publisher:
W. H. Freeman