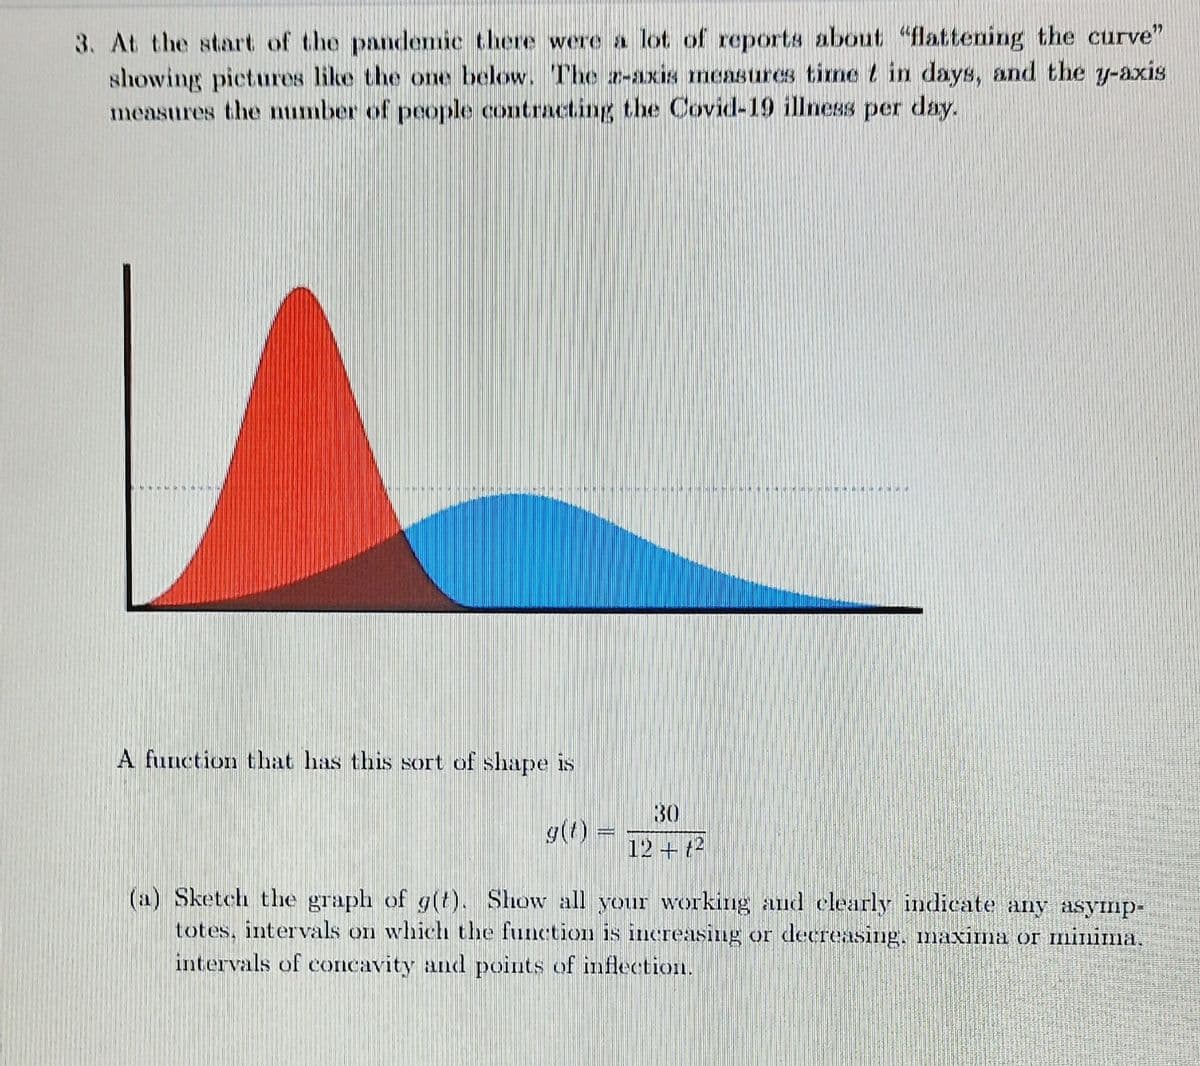
3. At the start of the pandemic there were a lot of reports about "flattening the curve" showing pictures like the one below. The ar-axis measures time t in days, and the y-axis measures the number of people contracting the Covid-19 illness per day. A function that has this sort of shape is 30 g(t) = 12 + t2 (a) Sketch the graph of g(t). Show all your working and clearly indicate any asymp- totes, intervals on which the function is increasing or decreasing, maxima or minima, intervals of concavity and points of inflection.


Minimization
In mathematics, traditional optimization problems are typically expressed in terms of minimization. When we talk about minimizing or maximizing a function, we refer to the maximum and minimum possible values of that function. This can be expressed in terms of global or local range. The definition of minimization in the thesaurus is the process of reducing something to a small amount, value, or position. Minimization (noun) is an instance of belittling or disparagement.
Maxima and Minima
The extreme points of a function are the maximum and the minimum points of the function. A maximum is attained when the function takes the maximum value and a minimum is attained when the function takes the minimum value.
Derivatives
A derivative means a change. Geometrically it can be represented as a line with some steepness. Imagine climbing a mountain which is very steep and 500 meters high. Is it easier to climb? Definitely not! Suppose walking on the road for 500 meters. Which one would be easier? Walking on the road would be much easier than climbing a mountain.
Concavity
In calculus, concavity is a descriptor of mathematics that tells about the shape of the graph. It is the parameter that helps to estimate the maximum and minimum value of any of the functions and the concave nature using the graphical method. We use the first derivative test and second derivative test to understand the concave behavior of the function.

Step by step
Solved in 2 steps


