3. By using the same prođuction function in question 2: Assume the followings: Parameters Equations s=0,20 marginal propensity to save Y = WK" L1-r Production Function %3! v=0,02 Population growth rate K = s. f(k) – aK Capital Accumulation b=0,04 Technological growth rate Population Growth = U a=0,05 Depreciation rate Technological Progress =b S = s.f(k) Savings Find steady-state level of capital per effective labor: k a. b. Draw a graph and show output function, actual investment and breakeven investment lines. с. Assume that in this economy, people start spending more and therefore marginal propensity to save decline permanently. What will happen to variables in the model d. (steady-state level capital per effective labor; output growth etc.). Instead of reduction in saving assume this time that we face lower fertility rate in the country. What will happen to variables in the mođel (steady-state level capital per effective labor; output growth etc.).
3. By using the same prođuction function in question 2: Assume the followings: Parameters Equations s=0,20 marginal propensity to save Y = WK" L1-r Production Function %3! v=0,02 Population growth rate K = s. f(k) – aK Capital Accumulation b=0,04 Technological growth rate Population Growth = U a=0,05 Depreciation rate Technological Progress =b S = s.f(k) Savings Find steady-state level of capital per effective labor: k a. b. Draw a graph and show output function, actual investment and breakeven investment lines. с. Assume that in this economy, people start spending more and therefore marginal propensity to save decline permanently. What will happen to variables in the model d. (steady-state level capital per effective labor; output growth etc.). Instead of reduction in saving assume this time that we face lower fertility rate in the country. What will happen to variables in the mođel (steady-state level capital per effective labor; output growth etc.).

Principles of Economics 2e
2nd Edition
ISBN:9781947172364
Author:Steven A. Greenlaw; David Shapiro
Publisher:Steven A. Greenlaw; David Shapiro
Chapter20: Economic Growth
Section: Chapter Questions
Problem 5SCQ: What do the growth accounting studies conclude are the determinants of growth? Which is more...

Related questions
Question
Transcribed Image Text:3.
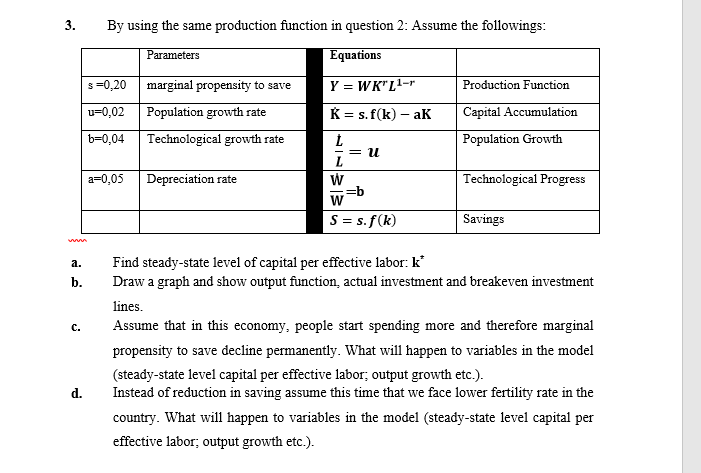
By using the same production function in question 2: Assume the followings:
Parameters
Equations
s=0,20
marginal propensity to save
Y = WK" L1-r
Production Function
u=0,02
Population growth rate
K = s. f(k) – aK
Capital Accumulation
b=0,04
Technological growth rate
Population Growth
= 1.
a=0,05
Depreciation rate
Technological Progress
=b
W
S = s. f(k)
Savings
Find steady-state level of capital per effective labor: k
Draw a graph and show output function, actual investment and breakeven investment
a.
b.
lines.
с.
Assume that in this economy, people start spending more and therefore marginal
propensity to save decline permanently. What will happen to variables in the model
(steady-state level capital per effective labor; output growth etc.).
Instead of reduction in saving assume this time that we face lower fertility rate in the
d.
country. What will happen to variables in the model (steady-state level capital per
effective labor; output growth etc.).
Expert Solution
This question has been solved!
Explore an expertly crafted, step-by-step solution for a thorough understanding of key concepts.

This is a popular solution!

Trending now
This is a popular solution!

Step by step
Solved in 6 steps with 5 images

Knowledge Booster


Learn more about
Need a deep-dive on the concept behind this application? Look no further. Learn more about this topic, economics and related others by exploring similar questions and additional content below.Recommended textbooks for you
Principles of Economics 2e
Economics
ISBN:
9781947172364
Author:
Steven A. Greenlaw; David Shapiro
Publisher:
OpenStax
Principles of Economics 2e
Economics
ISBN:
9781947172364
Author:
Steven A. Greenlaw; David Shapiro
Publisher:
OpenStax