3. Calculate the slope of the IS curve given the following two equations. (Hint: The IS curve is the relationship between Y and r, so you need to isolate Yt on one side.) C = 0.6(Y - G+) + 0.5(Y+1 - Gt+1) – 10r I = -20rt + At+1 - 0.2Kt Gt = G+1 = 10
3. Calculate the slope of the IS curve given the following two equations. (Hint: The IS curve is the relationship between Y and r, so you need to isolate Yt on one side.) C = 0.6(Y - G+) + 0.5(Y+1 - Gt+1) – 10r I = -20rt + At+1 - 0.2Kt Gt = G+1 = 10

Chapter1: What Is Economics
Section1.A: Using Graphs: A Review
Problem 4TY

Related questions
Question
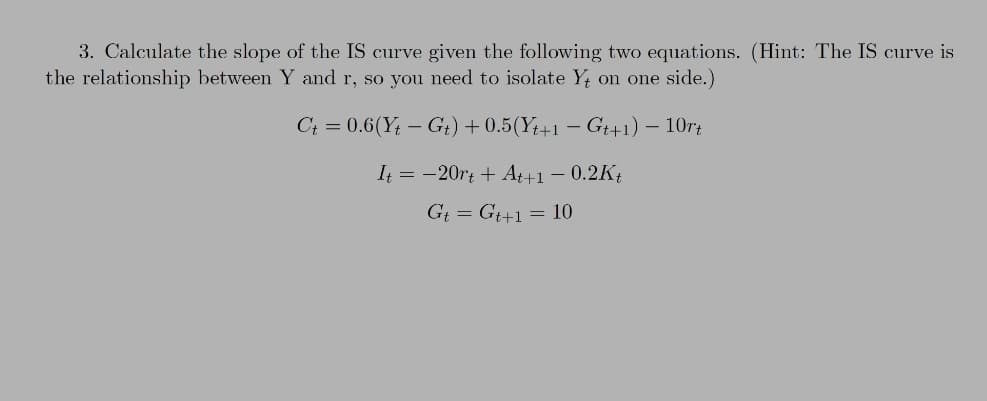
Transcribed Image Text:3. Calculate the slope of the IS curve given the following two equations. (Hint: The IS curve is
the relationship between Y and r, so you need to isolate Y; on one side.)
C+ = 0.6(Y; – G+) + 0.5(Y+1 – G+1) – 10rt
It = -20rt + At+1 – 0.2K{
Gt = G+1= 10
Expert Solution
This question has been solved!
Explore an expertly crafted, step-by-step solution for a thorough understanding of key concepts.

Step by step
Solved in 2 steps

Recommended textbooks for you

Microeconomics: Principles & Policy
Economics
ISBN:
9781337794992
Author:
William J. Baumol, Alan S. Blinder, John L. Solow
Publisher:
Cengage Learning

Microeconomics: Principles & Policy
Economics
ISBN:
9781337794992
Author:
William J. Baumol, Alan S. Blinder, John L. Solow
Publisher:
Cengage Learning


