3. Determine the number of possible samples of size 3 Show your solutions here.

MATLAB: An Introduction with Applications
6th Edition
ISBN:9781119256830
Author:Amos Gilat
Publisher:Amos Gilat
Chapter1: Starting With Matlab
Section: Chapter Questions
Problem 1P

Related questions
Question
3,4,5,6,7 AND 8 PLS
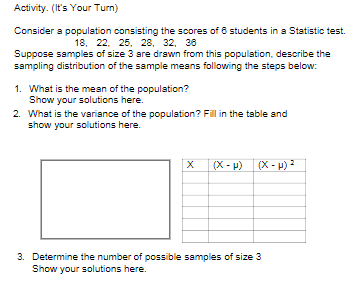
Transcribed Image Text:Activity. (It's Your Turn)
Consider a population consisting the scores of 8 students in a Statistic test.
18, 22. 25, 28, 32, 38
Suppose samples of size 3 are drawn from this population, describe the
sampling distribution of the sample means following the steps below:
1. What is the mean of the population?
Show your solutions here.
2. What is the variance of the population? Fill in the table and
show your solutions here.
(X - P)
(X - H) ?
3. Determine the number of possible samples of size 3
Show your solutions here.
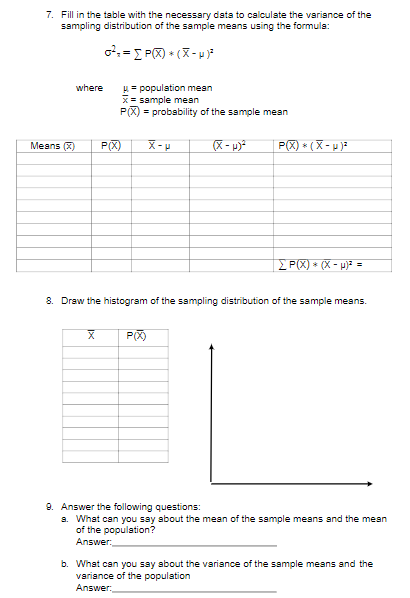
Transcribed Image Text:7. Fill in the table with the necessary data to calculate the variance of the
sampling distribution of the sample means using the formula:
where
= population mean
x= sample mean
P(X) = probability of the sample mean
Means (X)
P(X)
P(X) * ( X- u )?
P(X) * (X - p)? =
8. Draw the histogram of the sampling distribution of the sample means.
P(X)
9. Answer the following questions:
a. What can you say about the mean of the sample means sand the mean
of the population?
Answer
b. What can you say about the variance of the sample means and the
variance of the population
Answer:
Expert Solution
This question has been solved!
Explore an expertly crafted, step-by-step solution for a thorough understanding of key concepts.

This is a popular solution!

Trending now
This is a popular solution!

Step by step
Solved in 2 steps

Recommended textbooks for you
MATLAB: An Introduction with Applications
Statistics
ISBN:
9781119256830
Author:
Amos Gilat
Publisher:
John Wiley & Sons Inc

Probability and Statistics for Engineering and th…
Statistics
ISBN:
9781305251809
Author:
Jay L. Devore
Publisher:
Cengage Learning

Statistics for The Behavioral Sciences (MindTap C…
Statistics
ISBN:
9781305504912
Author:
Frederick J Gravetter, Larry B. Wallnau
Publisher:
Cengage Learning
MATLAB: An Introduction with Applications
Statistics
ISBN:
9781119256830
Author:
Amos Gilat
Publisher:
John Wiley & Sons Inc
Probability and Statistics for Engineering and th…
Statistics
ISBN:
9781305251809
Author:
Jay L. Devore
Publisher:
Cengage Learning
Statistics for The Behavioral Sciences (MindTap C…
Statistics
ISBN:
9781305504912
Author:
Frederick J Gravetter, Larry B. Wallnau
Publisher:
Cengage Learning

Elementary Statistics: Picturing the World (7th E…
Statistics
ISBN:
9780134683416
Author:
Ron Larson, Betsy Farber
Publisher:
PEARSON

The Basic Practice of Statistics
Statistics
ISBN:
9781319042578
Author:
David S. Moore, William I. Notz, Michael A. Fligner
Publisher:
W. H. Freeman

Introduction to the Practice of Statistics
Statistics
ISBN:
9781319013387
Author:
David S. Moore, George P. McCabe, Bruce A. Craig
Publisher:
W. H. Freeman