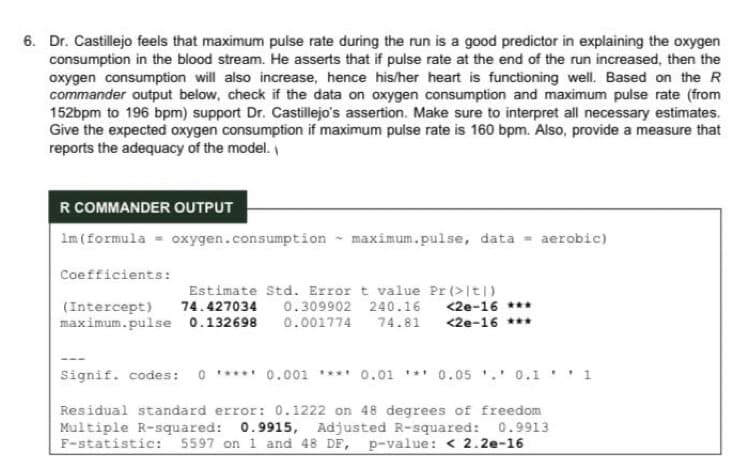
3. Dr. Castillejo feels that maximum pulse rate during the run is a good predictor in explaining the oxygen consumption in the blood stream. He asserts that if pulse rate at the end of the run increased, then the oxygen consumption will also increase, hence his/her heart is functioning well. Based on the R commander output below, check if the data on oxygen consumption and maximum pulse rate (from 152bpm to 196 bpm) support Dr. Castillejo's assertion. Make sure to interpret all necessary estimates. Give the expected oxygen consumption if maximum pulse rate is 160 bpm. Also, provide a measure that reports the adequacy of the model.
3. Dr. Castillejo feels that maximum pulse rate during the run is a good predictor in explaining the oxygen consumption in the blood stream. He asserts that if pulse rate at the end of the run increased, then the oxygen consumption will also increase, hence his/her heart is functioning well. Based on the R commander output below, check if the data on oxygen consumption and maximum pulse rate (from 152bpm to 196 bpm) support Dr. Castillejo's assertion. Make sure to interpret all necessary estimates. Give the expected oxygen consumption if maximum pulse rate is 160 bpm. Also, provide a measure that reports the adequacy of the model.

Linear Algebra: A Modern Introduction
4th Edition
ISBN:9781285463247
Author:David Poole
Publisher:David Poole
Chapter7: Distance And Approximation
Section7.3: Least Squares Approximation
Problem 31EQ

Related questions
Question
Transcribed Image Text:6. Dr. Castillejo feels that maximum pulse rate during the run is a good predictor in explaining the oxygen
consumption in the blood stream. He asserts that if pulse rate at the end of the run increased, then the
oxygen consumption will also increase, hence his/her heart is functioning well. Based on the R
commander output below, check if the data on oxygen consumption and maximum pulse rate (from
152bpm to 196 bpm) support Dr. Castillejo's assertion. Make sure to interpret all necessary estimates.
Give the expected oxygen consumption if maximum pulse rate is 160 bpm. Also, provide a measure that
reports the adequacy of the model.
R COMMANDER OUTPUT
1m (formula = oxygen.consumption maximum.pulse, data = aerobic)
Coefficients:
Estimate Std. Error t value Pr (>|t|)
(Intercept) 74.427034 0.309902 240.16 <2e-16
maximum.pulse 0.132698 0.001774 74.81 <2e-16 ***
Signif. codes: 0 ***** 0.001 **** 0.01 ***
*** 0.05 ¹.¹ 0.1 1
Residual standard error: 0.1222 on 48 degrees of freedom
Multiple R-squared: 0.9915, Adjusted R-squared: 0.9913
F-statistic: 5597 on 1 and 48 DF, p-value: <2.2e-16
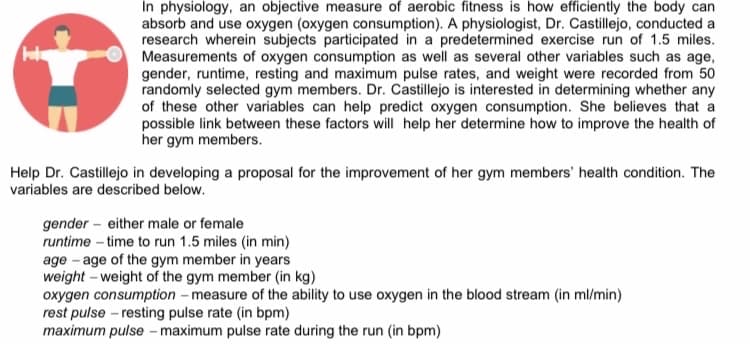
Transcribed Image Text:In physiology, an objective measure of aerobic fitness is how efficiently the body can
absorb and use oxygen (oxygen consumption). A physiologist, Dr. Castillejo, conducted a
research wherein subjects participated in a predetermined exercise run of 1.5 miles.
Measurements of oxygen consumption as well as several other variables such as age,
gender, runtime, resting and maximum pulse rates, and weight were recorded from 50
randomly selected gym members. Dr. Castillejo is interested in determining whether any
of these other variables can help predict oxygen consumption. She believes that a
possible link between these factors will help her determine how to improve the health of
her gym members.
Help Dr. Castillejo in developing a proposal for the improvement of her gym members' health condition. The
variables are described below.
gender- either male or female
runtime-time to run 1.5 miles (in min)
age age of the gym member in years
weight weight of the gym member (in kg)
oxygen consumption - measure of the ability to use oxygen in the blood stream (in ml/min)
rest pulse - resting pulse rate (in bpm)
maximum pulse - maximum pulse rate during the run (in bpm)
Expert Solution
This question has been solved!
Explore an expertly crafted, step-by-step solution for a thorough understanding of key concepts.

Step by step
Solved in 3 steps

Recommended textbooks for you
Linear Algebra: A Modern Introduction
Algebra
ISBN:
9781285463247
Author:
David Poole
Publisher:
Cengage Learning

Glencoe Algebra 1, Student Edition, 9780079039897…
Algebra
ISBN:
9780079039897
Author:
Carter
Publisher:
McGraw Hill
Linear Algebra: A Modern Introduction
Algebra
ISBN:
9781285463247
Author:
David Poole
Publisher:
Cengage Learning
Glencoe Algebra 1, Student Edition, 9780079039897…
Algebra
ISBN:
9780079039897
Author:
Carter
Publisher:
McGraw Hill