ACTIVITY 7.1.2: Number of Times Late and Grade of a Student

Algebra & Trigonometry with Analytic Geometry
13th Edition
ISBN:9781133382119
Author:Swokowski
Publisher:Swokowski
Chapter7: Analytic Trigonometry
Section7.6: The Inverse Trigonometric Functions
Problem 93E

Related questions
Question
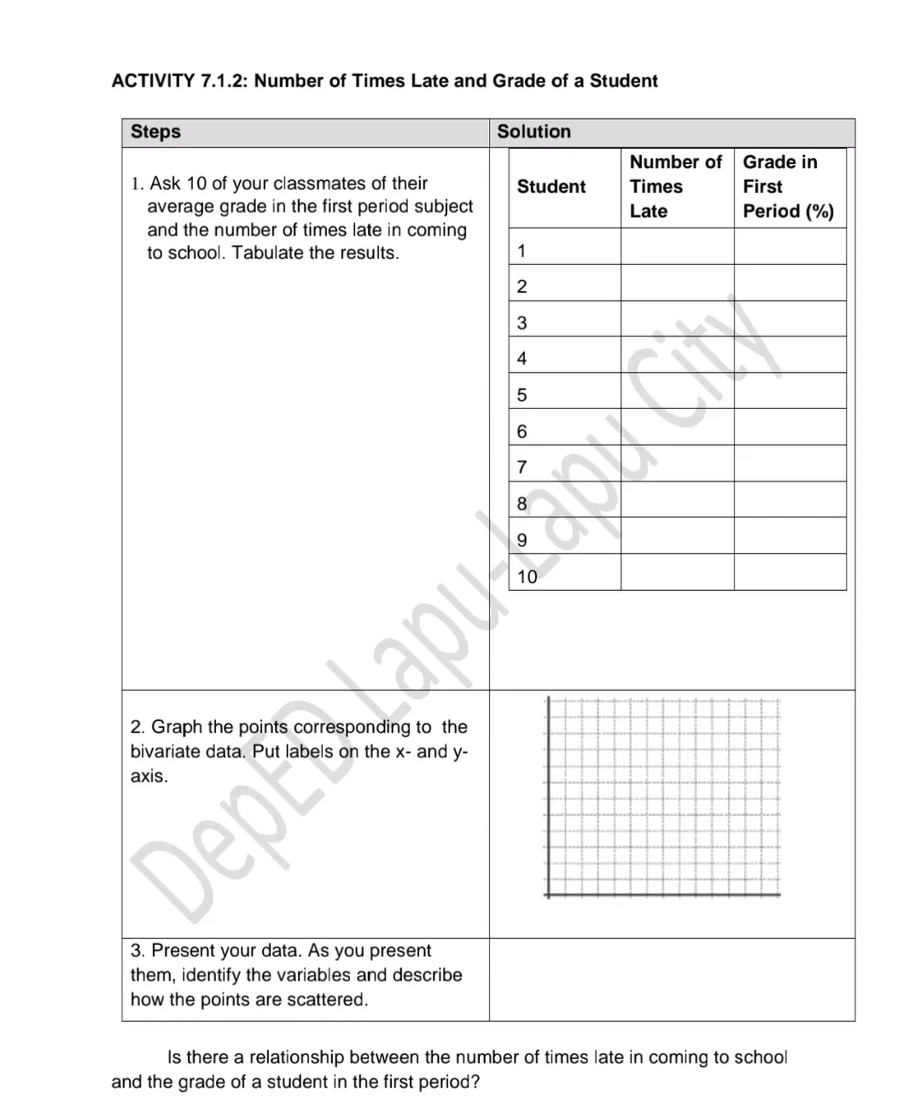
Transcribed Image Text:ACTIVITY 7.1.2: Number of Times Late and Grade of a Student
Steps
Solution
1. Ask 10 of your classmates of their
average grade in the first period subject
and the number of times late in coming
to school. Tabulate the results.
axis.
Student
1
2
3
4
5
6
Number of
Times
Late
Grade in
First
Period (%)
Dept Lapu C
3. Present your data. As you present
them, identify the variables and describe
how the points are scattered.
Is there a relationship between the number of times late in coming to school
and the grade of a student in the first period?
Expert Solution
This question has been solved!
Explore an expertly crafted, step-by-step solution for a thorough understanding of key concepts.

Step by step
Solved in 2 steps with 2 images

Recommended textbooks for you
Algebra & Trigonometry with Analytic Geometry
Algebra
ISBN:
9781133382119
Author:
Swokowski
Publisher:
Cengage


Functions and Change: A Modeling Approach to Coll…
Algebra
ISBN:
9781337111348
Author:
Bruce Crauder, Benny Evans, Alan Noell
Publisher:
Cengage Learning
Algebra & Trigonometry with Analytic Geometry
Algebra
ISBN:
9781133382119
Author:
Swokowski
Publisher:
Cengage
Functions and Change: A Modeling Approach to Coll…
Algebra
ISBN:
9781337111348
Author:
Bruce Crauder, Benny Evans, Alan Noell
Publisher:
Cengage Learning

Algebra and Trigonometry (MindTap Course List)
Algebra
ISBN:
9781305071742
Author:
James Stewart, Lothar Redlin, Saleem Watson
Publisher:
Cengage Learning