3. In a factory which manufactures bolts, machines A, B and C manufacture respectively 25%, 35% and 40% of the bolts. Of their outputs, 5, 4 and 2 percent are respectively defective bolts. A bolt is drawn at random from the product and is found to be defective. What is the probability that it is manufactured by the machine B?
3. In a factory which manufactures bolts, machines A, B and C manufacture respectively 25%, 35% and 40% of the bolts. Of their outputs, 5, 4 and 2 percent are respectively defective bolts. A bolt is drawn at random from the product and is found to be defective. What is the probability that it is manufactured by the machine B?

MATLAB: An Introduction with Applications
6th Edition
ISBN:9781119256830
Author:Amos Gilat
Publisher:Amos Gilat
Chapter1: Starting With Matlab
Section: Chapter Questions
Problem 1P

Related questions

Topic Video
Question
How i can solve Q3:
Transcribed Image Text:۳:۳۹ م
150
Done STAT237 LAB 5_348cef10ed9ec0...
STAT237: LAB5
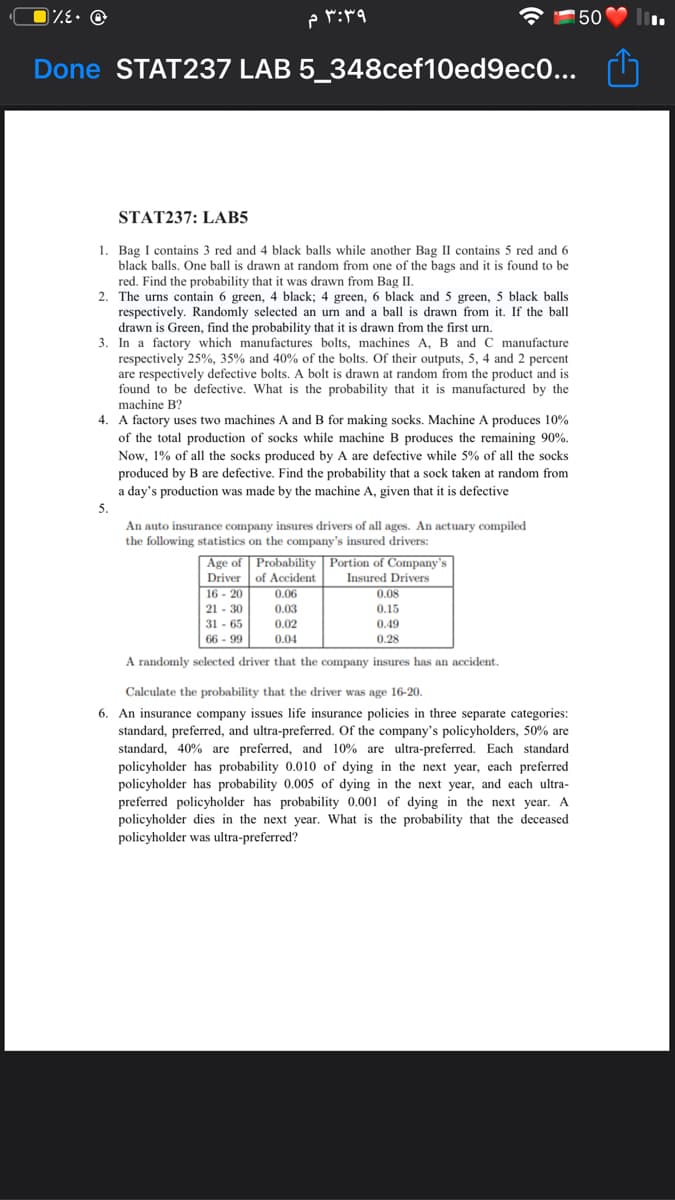
1. Bag I contains 3 red and 4 black balls while another Bag II contains 5 red and 6
black balls. One ball is drawn at random from one of the bags and it is found to be
red. Find the probability that it was drawn from Bag II.
2. The urns contain 6 green, 4 black; 4 green, 6 black and 5 green, 5 black balls
respectively. Randomly selected an urn and a ball is drawn from it. If the ball
drawn is Green, find the probability that it is drawn from the first urn.
3. In a factory which manufactures bolts, machines A, B and C manufacture
respectively 25%, 35% and 40% of the bolts. Of their outputs, 5, 4 and 2 percent
are respectively defective bolts. A bolt is drawn at random from the product and is
found to be defective. What is the probability that it is manufactured by the
machine B?
4. A factory uses two machines A and B for making socks. Machine A produces 10%
of the total production of socks while machine B produces the remaining 90%.
Now, 1% of all the socks produced by A are defective while 5% of all the socks
produced by B are defective. Find the probability that a sock taken at random from
a day's production was made by the machine A, given that it is defective
5.
An auto insurance company insures drivers of all ages. An actuary compiled
the following statistics on the company's insured drivers:
| Age of Probability Portion of Company's
Driver of Accident
16 - 20
21 - 30
31 - 65
66 - 99
Insured Drivers
0.06
0.03
0.08
0.15
0.02
0.04
0.49
0.28
A randomly selected driver that the company insures has an accident.
Calculate the probability that the driver was age 16-20.
6.
An insurance company issues life insurance policies in three separate categories:
standard, preferred, and ultra-preferred. Of the company's policyholders, 50% are
standard, 40% are preferred, and 10% are ultra-preferred. Each standard
policyholder has probability 0.010 of dying in the next year, each preferred
policyholder has probability 0.005 of dying in the next year, and each ultra-
preferred policyholder has probability 0.001 of dying in the next year. A
policyholder dies in the next year. What is the probability that the deceased
policyholder was ultra-preferred?
Expert Solution
This question has been solved!
Explore an expertly crafted, step-by-step solution for a thorough understanding of key concepts.

Step by step
Solved in 2 steps

Knowledge Booster


Learn more about
Need a deep-dive on the concept behind this application? Look no further. Learn more about this topic, statistics and related others by exploring similar questions and additional content below.Recommended textbooks for you
MATLAB: An Introduction with Applications
Statistics
ISBN:
9781119256830
Author:
Amos Gilat
Publisher:
John Wiley & Sons Inc

Probability and Statistics for Engineering and th…
Statistics
ISBN:
9781305251809
Author:
Jay L. Devore
Publisher:
Cengage Learning

Statistics for The Behavioral Sciences (MindTap C…
Statistics
ISBN:
9781305504912
Author:
Frederick J Gravetter, Larry B. Wallnau
Publisher:
Cengage Learning
MATLAB: An Introduction with Applications
Statistics
ISBN:
9781119256830
Author:
Amos Gilat
Publisher:
John Wiley & Sons Inc
Probability and Statistics for Engineering and th…
Statistics
ISBN:
9781305251809
Author:
Jay L. Devore
Publisher:
Cengage Learning
Statistics for The Behavioral Sciences (MindTap C…
Statistics
ISBN:
9781305504912
Author:
Frederick J Gravetter, Larry B. Wallnau
Publisher:
Cengage Learning

Elementary Statistics: Picturing the World (7th E…
Statistics
ISBN:
9780134683416
Author:
Ron Larson, Betsy Farber
Publisher:
PEARSON

The Basic Practice of Statistics
Statistics
ISBN:
9781319042578
Author:
David S. Moore, William I. Notz, Michael A. Fligner
Publisher:
W. H. Freeman

Introduction to the Practice of Statistics
Statistics
ISBN:
9781319013387
Author:
David S. Moore, George P. McCabe, Bruce A. Craig
Publisher:
W. H. Freeman