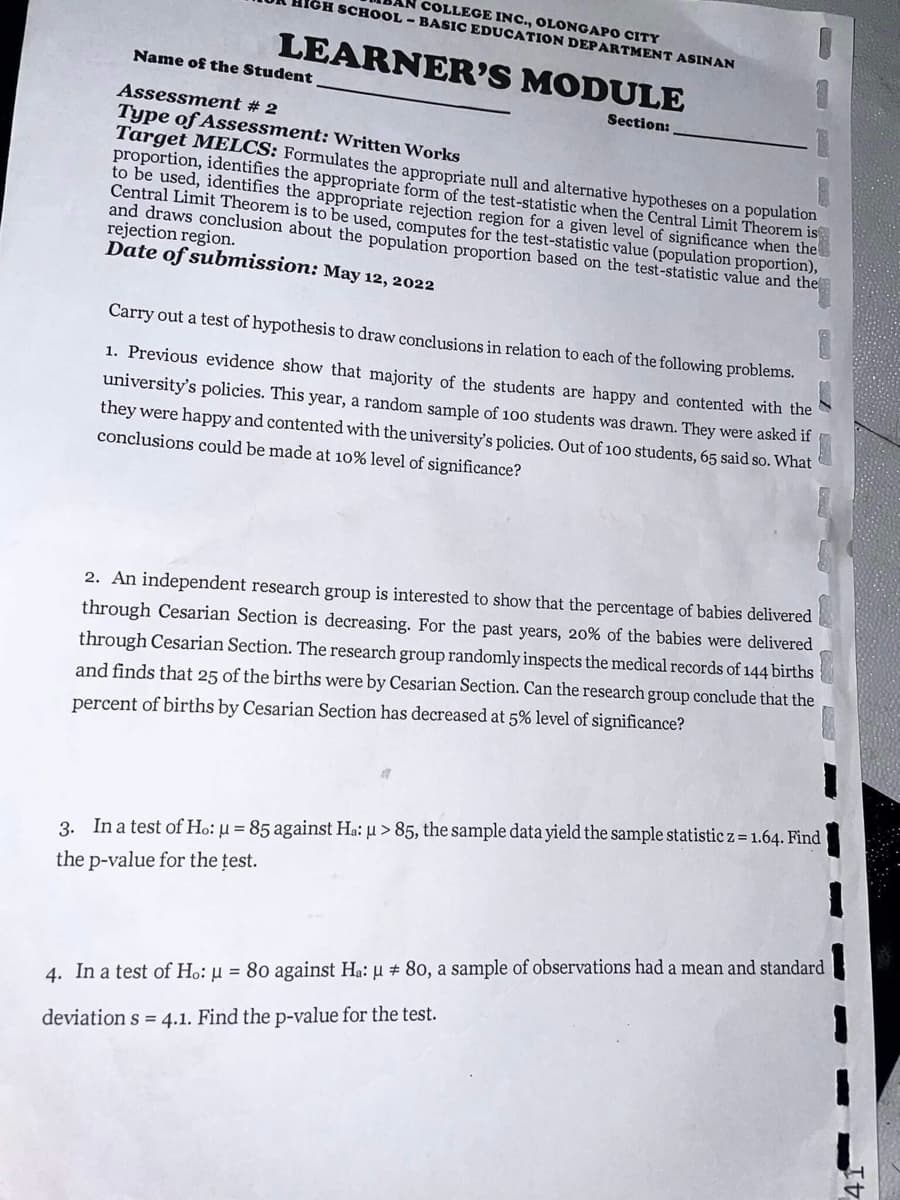
3. In a test of Ho: µ = 85 against Ha: u > 85, the sample data yield the sample statistic z=1.64. Find the p-value for the test.
3. In a test of Ho: µ = 85 against Ha: u > 85, the sample data yield the sample statistic z=1.64. Find the p-value for the test.
MATLAB: An Introduction with Applications
6th Edition
ISBN:9781119256830
Author:Amos Gilat
Publisher:Amos Gilat
Chapter1: Starting With Matlab
Section: Chapter Questions
Problem 1P
Related questions
Question
#4

Transcribed Image Text:COLLEGE INC., OLONGAPO CITY
IGH SCHOOL-BASIC EDUCATION DEPARTMENT ASINAN
LEARNER'S MODULE
Name of the Student
Section:
Assessment # 2
Type of Assessment: Written Works
Target MELCS: Formulates the appropriate null and alternative hypotheses on a population
proportion, identifies the appropriate form of the test-statistic when the Central Limit Theorem is
to be used, identifies the appropriate rejection region for a given level of significance when the
Central Limit Theorem is to be used, computes for the test-statistic value (population proportion),
and draws conclusion about the population proportion based on the test-statistic value and the
rejection region.
Date of submission: May 12, 2022
Carry out a test of hypothesis to draw conclusions in relation to each of the following problems.
1. Previous evidence show that majority of the students are happy and contented with the
university's policies. This year, a random sample of 100 students was drawn. They were asked if
they were happy and contented with the university's policies. Out of 100 students, 65 said so. What
conclusions could be made at 10% level of significance?
2. An independent research group is interested to show that the percentage of babies delivered
through Cesarian Section is decreasing. For the past years, 20% of the babies were delivered
through Cesarian Section. The research group randomly inspects the medical records of 144 births
and finds that 25 of the births were by Cesarian Section. Can the research group conclude that the
percent of births by Cesarian Section has decreased at 5% level of significance?
3. Ina test of Ho: µ = 85 against Ha: u > 85, the sample data yield the sample statistic z=1.64. Find
the p-value for the test.
4. In a test of Ho: µ = 80 against Ha: µ # 80, a sample of observations had a mean and standard
deviation s = 4.1. Find the p-value for the test.
Expert Solution
This question has been solved!
Explore an expertly crafted, step-by-step solution for a thorough understanding of key concepts.
Step by step
Solved in 2 steps

Recommended textbooks for you

MATLAB: An Introduction with Applications
Statistics
ISBN:
9781119256830
Author:
Amos Gilat
Publisher:
John Wiley & Sons Inc

Probability and Statistics for Engineering and th…
Statistics
ISBN:
9781305251809
Author:
Jay L. Devore
Publisher:
Cengage Learning

Statistics for The Behavioral Sciences (MindTap C…
Statistics
ISBN:
9781305504912
Author:
Frederick J Gravetter, Larry B. Wallnau
Publisher:
Cengage Learning

MATLAB: An Introduction with Applications
Statistics
ISBN:
9781119256830
Author:
Amos Gilat
Publisher:
John Wiley & Sons Inc

Probability and Statistics for Engineering and th…
Statistics
ISBN:
9781305251809
Author:
Jay L. Devore
Publisher:
Cengage Learning

Statistics for The Behavioral Sciences (MindTap C…
Statistics
ISBN:
9781305504912
Author:
Frederick J Gravetter, Larry B. Wallnau
Publisher:
Cengage Learning

Elementary Statistics: Picturing the World (7th E…
Statistics
ISBN:
9780134683416
Author:
Ron Larson, Betsy Farber
Publisher:
PEARSON

The Basic Practice of Statistics
Statistics
ISBN:
9781319042578
Author:
David S. Moore, William I. Notz, Michael A. Fligner
Publisher:
W. H. Freeman

Introduction to the Practice of Statistics
Statistics
ISBN:
9781319013387
Author:
David S. Moore, George P. McCabe, Bruce A. Craig
Publisher:
W. H. Freeman