3. Powder milk is packed in 1-kilogram. An inspector from the Department of Trade and Industry (DTI) suspects the bags may not contain 1 kilogram. A sample of 40 bags produced a mean of 0.96 kilogram and a standard deviation of 0.12 kilogram. Is there enough evidence that the bags do not contain 1 kilogram? Use a = 0.01.
3. Powder milk is packed in 1-kilogram. An inspector from the Department of Trade and Industry (DTI) suspects the bags may not contain 1 kilogram. A sample of 40 bags produced a mean of 0.96 kilogram and a standard deviation of 0.12 kilogram. Is there enough evidence that the bags do not contain 1 kilogram? Use a = 0.01.

MATLAB: An Introduction with Applications
6th Edition
ISBN:9781119256830
Author:Amos Gilat
Publisher:Amos Gilat
Chapter1: Starting With Matlab
Section: Chapter Questions
Problem 1P

Related questions
Question
answer no. 3
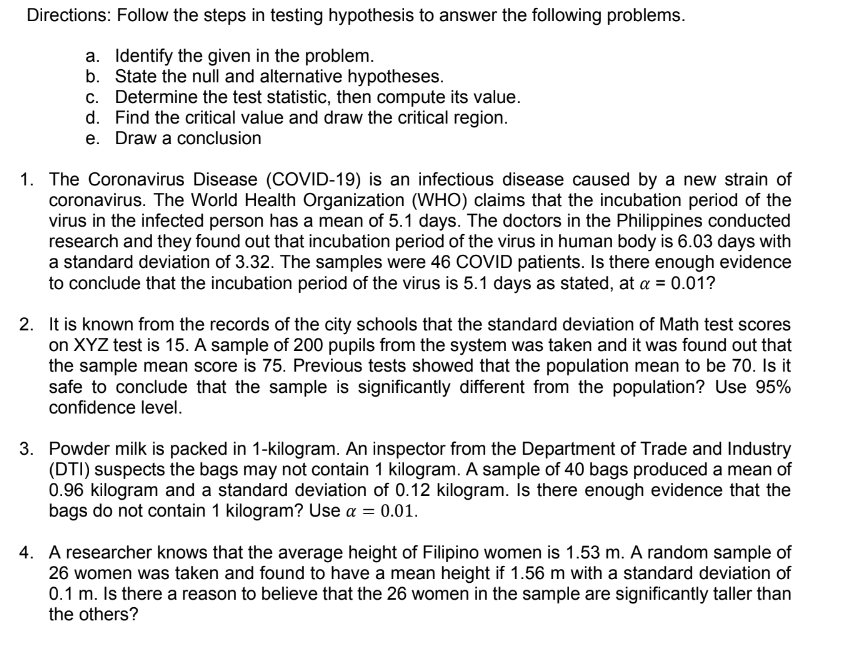
Transcribed Image Text:Directions: Follow the steps in testing hypothesis to answer the following problems.
a. Identify the given in the problem.
b. State the null and alternative hypotheses.
c. Determine the test statistic, then compute its value.
d. Find the critical value and draw the critical region.
e. Draw a conclusion
1. The Coronavirus Disease (COVID-19) is an infectious disease caused by a new strain of
coronavirus. The World Health Organization (WHO) claims that the incubation period of the
virus in the infected person has a mean of 5.1 days. The doctors in the Philippines conducted
research and they found out that incubation period of the virus in human body is 6.03 days with
a standard deviation of 3.32. The samples were 46 COVID patients. Is there enough evidence
to conclude that the incubation period of the virus is 5.1 days as stated, at a = 0.01?
2. It is known from the records of the city schools that the standard deviation of Math test scores
on XYZ test is 15. A sample of 200 pupils from the system was taken and it was found out that
the sample mean score is 75. Previous tests showed that the population mean to be 70. Is it
safe to conclude that the sample is significantly different from the population? Use 95%
confidence level.
3. Powder milk is packed in 1-kilogram. An inspector from the Department of Trade and Industry
(DTI) suspects the bags may not contain 1 kilogram. A sample of 40 bags produced a mean of
0.96 kilogram and a standard deviation of 0.12 kilogram. Is there enough evidence that the
bags do not contain 1 kilogram? Use a = 0.01.
4. A researcher knows that the average height of Filipino women is 1.53 m. A random sample of
26 women was taken and found to have a mean height if 1.56 m with a standard deviation of
0.1 m. Is there a reason to believe that the 26 women in the sample are significantly taller than
the others?
Expert Solution
This question has been solved!
Explore an expertly crafted, step-by-step solution for a thorough understanding of key concepts.

Step by step
Solved in 2 steps with 2 images

Recommended textbooks for you
MATLAB: An Introduction with Applications
Statistics
ISBN:
9781119256830
Author:
Amos Gilat
Publisher:
John Wiley & Sons Inc

Probability and Statistics for Engineering and th…
Statistics
ISBN:
9781305251809
Author:
Jay L. Devore
Publisher:
Cengage Learning

Statistics for The Behavioral Sciences (MindTap C…
Statistics
ISBN:
9781305504912
Author:
Frederick J Gravetter, Larry B. Wallnau
Publisher:
Cengage Learning
MATLAB: An Introduction with Applications
Statistics
ISBN:
9781119256830
Author:
Amos Gilat
Publisher:
John Wiley & Sons Inc
Probability and Statistics for Engineering and th…
Statistics
ISBN:
9781305251809
Author:
Jay L. Devore
Publisher:
Cengage Learning
Statistics for The Behavioral Sciences (MindTap C…
Statistics
ISBN:
9781305504912
Author:
Frederick J Gravetter, Larry B. Wallnau
Publisher:
Cengage Learning

Elementary Statistics: Picturing the World (7th E…
Statistics
ISBN:
9780134683416
Author:
Ron Larson, Betsy Farber
Publisher:
PEARSON

The Basic Practice of Statistics
Statistics
ISBN:
9781319042578
Author:
David S. Moore, William I. Notz, Michael A. Fligner
Publisher:
W. H. Freeman

Introduction to the Practice of Statistics
Statistics
ISBN:
9781319013387
Author:
David S. Moore, George P. McCabe, Bruce A. Craig
Publisher:
W. H. Freeman