3. Suppose you won $15 on a lotto ticket at the local 7-Eleven and decided to spend all the winnings on candy bars and bags of peanuts. Candy bars cost $0.75 each while bags of peanuts cost $1.50 each. LO1.5 a. Construct a table showing the alternative combinations of the two products that are available. b. Plot the data in your table as a budget line in a graph. What is the slope of the budget line? What is the oppor- tunity cost of one more candy bar? Of one more bag of
3. Suppose you won $15 on a lotto ticket at the local 7-Eleven and decided to spend all the winnings on candy bars and bags of peanuts. Candy bars cost $0.75 each while bags of peanuts cost $1.50 each. LO1.5 a. Construct a table showing the alternative combinations of the two products that are available. b. Plot the data in your table as a budget line in a graph. What is the slope of the budget line? What is the oppor- tunity cost of one more candy bar? Of one more bag of

Micro Economics For Today
10th Edition
ISBN:9781337613064
Author:Tucker, Irvin B.
Publisher:Tucker, Irvin B.
Chapter6: Consumer Choice Theory
Section6.A: Indifference Curve Analysis
Problem 2SQP

Related questions
Question
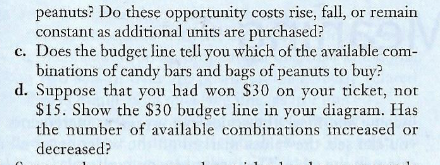
Transcribed Image Text:peanuts? Do these opportunity costs rise, fall, or remain
constant as additional units are purchased?
c. Does the budget line tell you which of the available com-
binations of candy bars and bags of peanuts to buy?
d. Suppose that you had won S30 on your ticket, not
$15. Show the $30 budget line in your diagram. Has
the number of available combinations increased or
decreased?
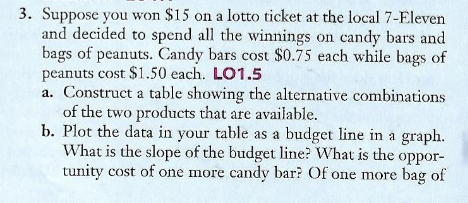
Transcribed Image Text:3. Suppose you won $15 on a lotto ticket at the local 7-Eleven
and decided to spend all the winnings on candy bars and
bags of peanuts. Candy bars cost $0.75 each while bags of
peanuts cost $1.50 each. LO1.5
a. Construct a table showing the alternative combinations
of the two products that are available.
b. Plot the data in your table as a budget line in a graph.
What is the slope of the budget line? What is the oppor-
tunity cost of one more candy bar? Of one more bag of
Expert Solution
This question has been solved!
Explore an expertly crafted, step-by-step solution for a thorough understanding of key concepts.

This is a popular solution!

Trending now
This is a popular solution!

Step by step
Solved in 4 steps with 3 images

Follow-up Questions
Read through expert solutions to related follow-up questions below.
Follow-up Question
I need to understand how to come up with the answers for the table. This explanation does not help me understand how to do these types of problems on my own in the future. Please show the formulas.
Solution
Knowledge Booster


Learn more about
Need a deep-dive on the concept behind this application? Look no further. Learn more about this topic, economics and related others by exploring similar questions and additional content below.Recommended textbooks for you


Principles of Microeconomics
Economics
ISBN:
9781305156050
Author:
N. Gregory Mankiw
Publisher:
Cengage Learning
Principles of Microeconomics
Economics
ISBN:
9781305156050
Author:
N. Gregory Mankiw
Publisher:
Cengage Learning