3. Test a hypothesis that single/never married Americans spend more time watching TV than married Americans (TVHOURS, MARITAL). Use a=0.05. (Hint: look up the values for "single/never married" and “married" first). Ho: 1µ = 2µ H1: 1µ > 2µ Group Statistics Std. Std. Error Marital status Mean Deviation Mean Hours per day NEVER 540 2.86 2.872 .124 watching TV MARRIED MARRIED 782 2.65 2.142 .077 Independent Samples Test Levene's Test for Equality of Variances t-test for Equality of Means 95% Confidence Interval of the Difference Std. Error Difference Significance Mean Difference Lower Upper Sig df One-Sided p Two-Sided p .216 138 054 487 18.131 <.001 1.569 1320 058 117 Hours per day watching TV Equal variances assumed 502 .068 .137 216 .145 -069 1.489 937.125 Equal variances not assumed
3. Test a hypothesis that single/never married Americans spend more time watching TV than married Americans (TVHOURS, MARITAL). Use a=0.05. (Hint: look up the values for "single/never married" and “married" first). Ho: 1µ = 2µ H1: 1µ > 2µ Group Statistics Std. Std. Error Marital status Mean Deviation Mean Hours per day NEVER 540 2.86 2.872 .124 watching TV MARRIED MARRIED 782 2.65 2.142 .077 Independent Samples Test Levene's Test for Equality of Variances t-test for Equality of Means 95% Confidence Interval of the Difference Std. Error Difference Significance Mean Difference Lower Upper Sig df One-Sided p Two-Sided p .216 138 054 487 18.131 <.001 1.569 1320 058 117 Hours per day watching TV Equal variances assumed 502 .068 .137 216 .145 -069 1.489 937.125 Equal variances not assumed

MATLAB: An Introduction with Applications
6th Edition
ISBN:9781119256830
Author:Amos Gilat
Publisher:Amos Gilat
Chapter1: Starting With Matlab
Section: Chapter Questions
Problem 1P

Related questions
Question
EITHER state the critical values and use the critical values/z-obtained comparison OR use the p-value/alpha comparison to make a decision
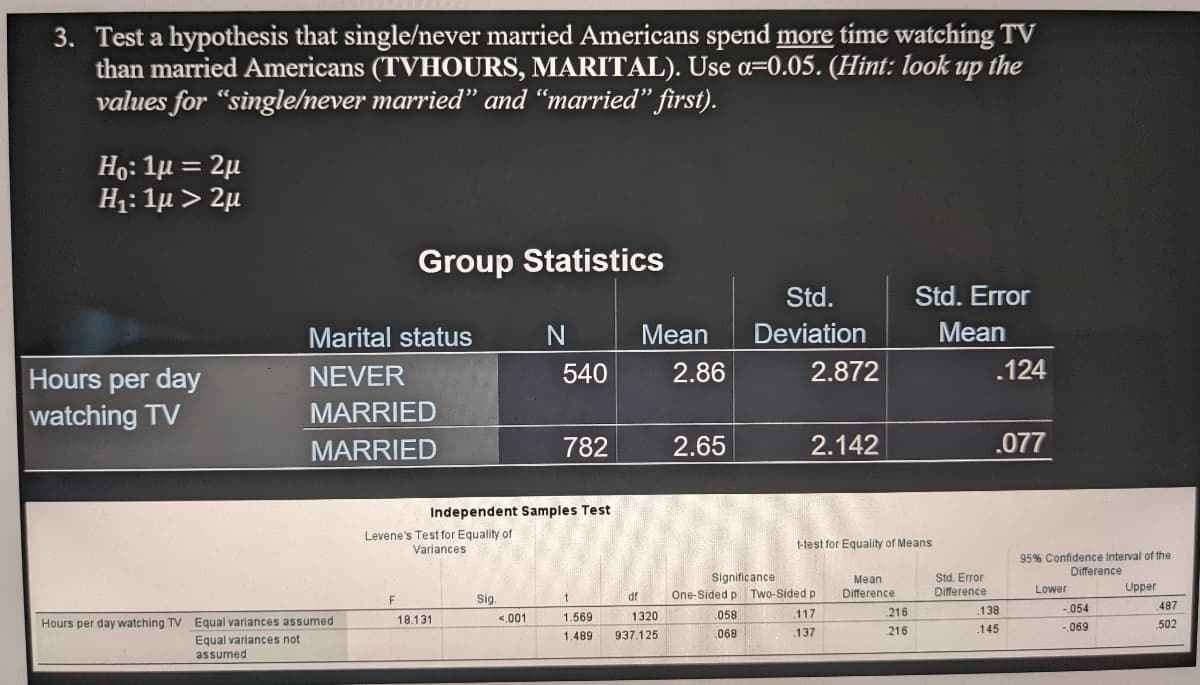
Transcribed Image Text:3. Test a hypothesis that single/never married Americans spend more time watching TV
than married Americans (TVHOURS, MARITAL). Use a=0.05. (Hint: look up the
values for "single/never married" and “married" first).
Họ: 1µ = 2µ
%3D
H1: 1µ > 2µ
Group Statistics
Std.
Std. Error
Marital status
Mean
Deviation
Mean
540
2.86
2.872
.124
Hours per day
watching TV
NEVER
MARRIED
MARRIED
782
2.65
2.142
.077
Independent Samples Test
Levene's Test for Equality of
Variances
t-test for Equality of Means
95% Confidence Interval of the
Difference
Significance
One-Sided p Two-Sided p
Std. Error
Difference
Mean
Lower
Upper
Sig.
df
Difference
F
.216
.138
-.054
487
18.131
<.001
1.569
1320
.058
.117
Hours per day watching TV Equal variances assumed
.502
.068
.137
.216
.145
-.069
1.489
937.125
Equal variances not
assumed
Expert Solution
This question has been solved!
Explore an expertly crafted, step-by-step solution for a thorough understanding of key concepts.

Step by step
Solved in 2 steps

Recommended textbooks for you
MATLAB: An Introduction with Applications
Statistics
ISBN:
9781119256830
Author:
Amos Gilat
Publisher:
John Wiley & Sons Inc

Probability and Statistics for Engineering and th…
Statistics
ISBN:
9781305251809
Author:
Jay L. Devore
Publisher:
Cengage Learning

Statistics for The Behavioral Sciences (MindTap C…
Statistics
ISBN:
9781305504912
Author:
Frederick J Gravetter, Larry B. Wallnau
Publisher:
Cengage Learning
MATLAB: An Introduction with Applications
Statistics
ISBN:
9781119256830
Author:
Amos Gilat
Publisher:
John Wiley & Sons Inc
Probability and Statistics for Engineering and th…
Statistics
ISBN:
9781305251809
Author:
Jay L. Devore
Publisher:
Cengage Learning
Statistics for The Behavioral Sciences (MindTap C…
Statistics
ISBN:
9781305504912
Author:
Frederick J Gravetter, Larry B. Wallnau
Publisher:
Cengage Learning

Elementary Statistics: Picturing the World (7th E…
Statistics
ISBN:
9780134683416
Author:
Ron Larson, Betsy Farber
Publisher:
PEARSON

The Basic Practice of Statistics
Statistics
ISBN:
9781319042578
Author:
David S. Moore, William I. Notz, Michael A. Fligner
Publisher:
W. H. Freeman

Introduction to the Practice of Statistics
Statistics
ISBN:
9781319013387
Author:
David S. Moore, George P. McCabe, Bruce A. Craig
Publisher:
W. H. Freeman