3. The dependent variable of the following regression result is the log value of hourly wage. Please make your answers to the following questions. 1) What do you think is the potential problem with this regression equation? If there is a problem here, how would you solve it? 2) Heteroskedasticity robust standard errors were used in this analysis. Why do you think this analysis used heteroskedasticity robust standard errors?
3. The dependent variable of the following regression result is the log value of hourly wage. Please make your answers to the following questions. 1) What do you think is the potential problem with this regression equation? If there is a problem here, how would you solve it? 2) Heteroskedasticity robust standard errors were used in this analysis. Why do you think this analysis used heteroskedasticity robust standard errors?

College Algebra
7th Edition
ISBN:9781305115545
Author:James Stewart, Lothar Redlin, Saleem Watson
Publisher:James Stewart, Lothar Redlin, Saleem Watson
Chapter1: Equations And Graphs
Section: Chapter Questions
Problem 10T: Olympic Pole Vault The graph in Figure 7 indicates that in recent years the winning Olympic men’s...

Related questions
Question
Transcribed Image Text:.***
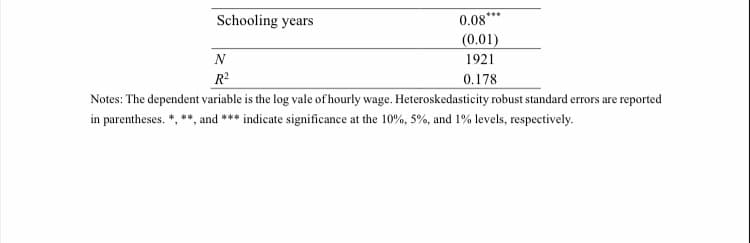
Schooling years
0.08**
(0.01)
N
1921
R²
0.178
Notes: The dependent variable is the log vale of hourly wage. Heteroskedasticity robust standard errors are reported
in parentheses. *, **, and *** indicate significance at the 10%, 5%, and 1% levels, respectively.
Transcribed Image Text:3. The dependent variable of the following regression result is
the log value of hourly wage. Please make your answers to the
following questions.
1) What do you think is the potential problem with this
regression equation? If there is a problem here, how would you
solve it?
2) Heteroskedasticity robust standard errors were used in this
analysis. Why do you think this analysis used heteroskedasticity
robust standard errors?
Expert Solution
This question has been solved!
Explore an expertly crafted, step-by-step solution for a thorough understanding of key concepts.

Step by step
Solved in 2 steps

Recommended textbooks for you
College Algebra
Algebra
ISBN:
9781305115545
Author:
James Stewart, Lothar Redlin, Saleem Watson
Publisher:
Cengage Learning
College Algebra
Algebra
ISBN:
9781305115545
Author:
James Stewart, Lothar Redlin, Saleem Watson
Publisher:
Cengage Learning