Based on the above regression results does jailing more criminals ((INPRISON06) reduce violent crime rates? Please explain. based on the above regression results if a greater proportion of the adult population is in prison (PCTINCAR06) will that lead to a drop in violent crimes per 100,000 residents? Please explain. Based on the above regression results will hiring additional police reduce violent crime rates? Please explain.
Based on the above regression results does jailing more criminals ((INPRISON06) reduce violent crime rates? Please explain. based on the above regression results if a greater proportion of the adult population is in prison (PCTINCAR06) will that lead to a drop in violent crimes per 100,000 residents? Please explain. Based on the above regression results will hiring additional police reduce violent crime rates? Please explain.

Linear Algebra: A Modern Introduction
4th Edition
ISBN:9781285463247
Author:David Poole
Publisher:David Poole
Chapter4: Eigenvalues And Eigenvectors
Section4.6: Applications And The Perron-frobenius Theorem
Problem 25EQ

Related questions
Question
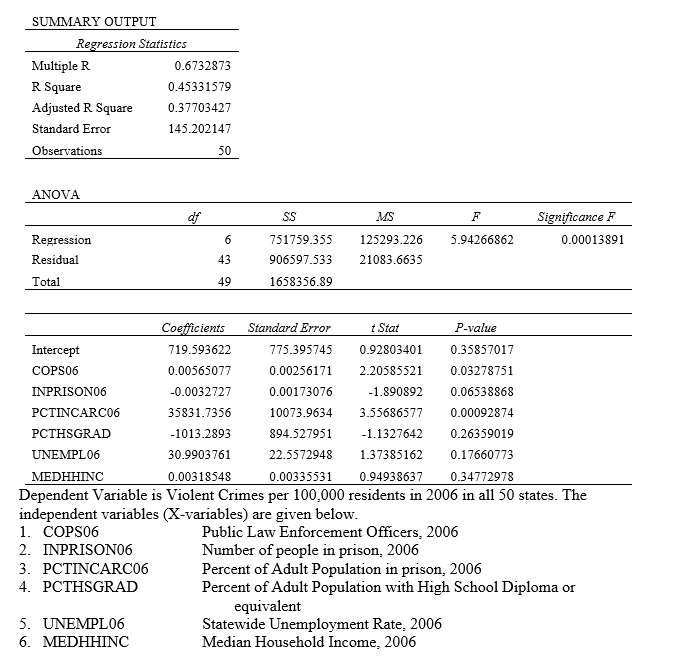
- Based on the above regression results does jailing more criminals ((INPRISON06) reduce violent crime rates? Please explain.
- based on the above regression results if a greater proportion of the adult population is in prison (PCTINCAR06) will that lead to a drop in violent crimes per 100,000 residents? Please explain.
- Based on the above regression results will hiring additional police reduce violent crime rates? Please explain.
Transcribed Image Text:SUMMARY OUTPUT
Regression Statistics
Multiple R
R Square
Adjusted R Square
Standard Error
Observations
ANOVA
Regression
Residual
Total
Intercept
COPS06
1. COPS06
2. INPRISON06
3. PCTINCARC06
4. PCTHSGRAD
0.6732873
0.45331579
0.37703427
145.202147
5. UNEMPL06
6. MEDHHINC
df
50
6
43
49
SS
MS
751759.355 125293.226
906597.533
21083.6635
1658356.89
t Stat
P-value
775.395745
0.92803401
0.35857017
0.00256171 2.20585521
0.03278751
INPRISON06
0.00173076
-1.890892 0.06538868
PCTINCARC06
10073.9634
3.55686577
0.00092874
PCTHSGRAD
894.527951
-1.1327642
0.26359019
UNEMPL06
22.5572948
1.37385162
0.17660773
MEDHHINC
0.00318548
0.00335531 0.94938637 0.34772978
Dependent Variable is Violent Crimes per 100,000 residents in 2006 in all 50 states. The
independent variables (X-variables) are given below.
Public Law Enforcement Officers, 2006
Coefficients Standard Error
719.593622
0.00565077
-0.0032727
35831.7356
-1013.2893
30.9903761
F
5.94266862
Significance F
Statewide Unemployment Rate, 2006
Median Household Income, 2006
0.00013891
Number of people in prison, 2006
Percent of Adult Population in prison, 2006
Percent of Adult Population with High School Diploma or
equivalent
Expert Solution
This question has been solved!
Explore an expertly crafted, step-by-step solution for a thorough understanding of key concepts.

This is a popular solution!

Trending now
This is a popular solution!

Step by step
Solved in 2 steps

Recommended textbooks for you
Linear Algebra: A Modern Introduction
Algebra
ISBN:
9781285463247
Author:
David Poole
Publisher:
Cengage Learning
Linear Algebra: A Modern Introduction
Algebra
ISBN:
9781285463247
Author:
David Poole
Publisher:
Cengage Learning