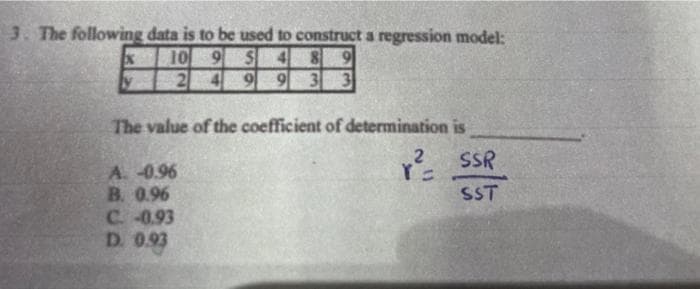
3. The following data is to be used to construct a regression model: 10 9 4 y S4 8 9 9 9 3 3 The value of the coefficient of determination is r² SSR SST A. -0.96 B. 0.96 C -0.93 D. 0.93
Q: Suppose that the sample of data that you are given is as follows: Observation Value 18 -5 23 16 4 45…
A: Given data:
Q: eview the table labeled Figure 3: Car Dataset Used By Police Force. Attribute A shows if a car was…
A: The attribute B shows if a car has a plate number and class attribute shows if a car was stolen.
Q: Probability Theory studies the mathematical chances of something happening based on real and…
A:
Q: A vacation resort has determined the probability of a customer giving the resort a 3-star rating or…
A:
Q: Q9. Suppose that we took 7 mice and measured their body weight and their length from nose to tail.…
A: Given data: .
Q: For the past 10 years, you have been observing the sales of your company since you embarked on an…
A: Scatterplot
Q: Venn Diagrams: Example 7 4 2 1 5 3 B ➤Find AB, BC, ANC, B'NA, AΜBNC, (AUB) NC'? S
A:
Q: A group of 30 students were sampled and measured their height. The average height was 168cm, with a…
A: Obtain the weight represents the 5th percentile. The weight represents the 5th percentile is…
Q: Is the power set of {2, 3, 4, 5} a subset of the power set of {1, 2, 3, 4, 5, 6}? Why or why not?
A:
Q: The probabilities of two events A and B are 0.23 and 0.30 respectively. The probability that both…
A:
Q: The Big Mac index is a way of measuring Purchasing Power Parity (PPP) between different countries.…
A: Data is given for price and countries We have to calculate mean and standard deviation We have to…
Q: In order to determine whether or not there is a significant difference between the mean hourly wages…
A: From the provided information, Sample size (n1) = 70 and n2 = 55 Sample mean (x̄1) = $15.75 and x̄2…
Q: Haley wants to allow 1/12 hours for chicken soup to cool before serving. It takes 1/2 hour to cook…
A:
Q: 10. The variable X has a uniform distribution on the interval (-2,3) then E(X)= a. 31/12 b.25/12 c.…
A: Since you have asked multiple question, we will solve the first question for you. If you want any…
Q: Two cards are selected from a standard deck of 52 playing cards. The first card is not replaced…
A: Given that Two cards are randomly selected from deck of 52 cards. No replacement is done. We know…
Q: political action committee is interested in the proportion of all registered voters who will vote…
A: Six examples are given with six vocabulary word.
Q: The daily production rates (in units per hour) for a sample of factory workers before and after a…
A: Data given Worker Before After 1 12 14 2 9 11 3 10 13 4 11 12 5 8 11
Q: K A stem-and-leaf plot for the number of touchdowns scored by all Division 1A football teams is…
A: Given that : A stem and leaf plot for the number of touchdowns. To find the required probabilities.
Q: Another measure of central tendency is the trimmed mean. It is computed by determining the mean of a…
A: Given: Sample size n = 50 Formula Used: Mean = ∑Xin
Q: 9. What is the probability that a randomly selected person is a Male or in favor of the statement?…
A: P(male and in favor) = 108/500= 0.216
Q: A random sample of 9 students selected from the student body of a high school had an average age of…
A: It is given that Sample size n = 9 Sample mean M = 14 Population SD = 1
Q: Does amount of caffeine affect memory? This study was conducted using 30 participants who report…
A: Given situation: Claim: Does amount of caffeine affect memory?. There are three caffeine conditions:…
Q: bank manager is interested in the average length of time that customers are willing to wait in line…
A: Introduction : Statistic : A quantity which is obtained from sample. It is a numerical measure of a…
Q: The TSA randomly swabs carryon bags to test for traces of explosives. After swabbing the luggage…
A: Introduction: Denote X as the swab result of a randomly selected bag with explosives, and Y as the…
Q: Use the bar graph below, which shows the highest level of education received by employees of a…
A: Given that Data of highest level of education received by employees of a company. From Graph A = 5…
Q: For observation study, determine whether cross-sectional, retrospective, or prospective is used.…
A: Cross-sectional is the weakest type of observational study in which the researcher simply gathers a…
Q: How many different 10-letter words (real or imaginary) can be formed from the following letters? K,…
A: The question is about permutation Given : No. of letters in words ( n ) = 10 No. of times " K "…
Q: 1/For the below frequency distribution table calculate all the below reequipments. Class Frequency…
A: Given information: The given frequency distribution table: Class Frequency 2-4 7 6-8 8…
Q: The current in a certain circuit as measured by an ammeter is a continuous random variable X with…
A: As per given instructions i have to slove part (d) only
Q: 97. Identity theft is now one of the most costly crimes in the United States, and younger adults are…
A: Concept : Pie chart and graph are used for graphical representation of quantitative data analysis.…
Q: n x² = Σ i=1 (O₁ - E₁)² Ei Prove that the above statistic follows a chi-square distribution with al…
A: Solution-: We want to prove χ2=∑i=1k(Oi-Ei)2Ei with determination of degree of freedom
Q: At one point the average price of regular unleaded gasoline was $3.75 per gallon. Assume that the…
A: a) Suppose a random variable X defines the price of regular unleaded gasoline.
Q: The heights (in inches) of 30 adult males are listed below. Construct a stem-and-leaf chart for the…
A: Given information: Heights707271706973696870716771707469687171717269716867737470716968
Q: 5 Consider the Markov chain with transition matrix (1/4-3/4) Find the fundamental matrix Z for this…
A:
Q: Brendan runs a small company with 10 employees. He needs to send a team of employees on a busness…
A: The question is about sampling Given : Total no. of employees in a company = 10 These employees are…
Q: Fill in the blank. Events that are Events that are cannot occur at the same time. unusual cannot…
A: It is given that when the events that are cannot occur at the same time.
Q: A jeweler averages 10 sales per day. Records show 9% of customers make a purchase. In a random…
A: In this case, each customer has the only options of "making a purchase" (i.e., defined as success)…
Q: hydraulic press between each cycle of the press. the operator is at risk from a crushing injury due…
A: Failure Type Frequency Effect Flexible hose failure 0.2 a Detachment of press tool 0.1 a…
Q: Steele Industries has decided to use an R-Chart to monitor the changes in the variability of their…
A: From the given question we can write n=7 and m=18.
Q: 3. The probability density function of the length of a cutting blade is f(x)=1.25 for 74.6 < x <…
A:
Q: Compute the correlation coefficient (r) of consumption and price
A: Given data: Consumption Price 0.386 1.35 0.474 1.5 0.393 1.39 0.425 1.49 0.406 1.36…
Q: The sample variance is: A) a sample statistic B) a parameter C) a measure of central…
A: It is needed to determine what the sample variance is.
Q: 1. Create a sample space for the number of options at Patti's Ice Cream Shoppe. Customers must…
A: Given information: Total no. of containers=3(Waffle Cone(W), Cake Cone (C), Cup (P))Total no. of…
Q: Data was collected for 300 fish from the North Atlantic. The length of the fish (in mm) is…
A: Introduction Data are placed into simpler sections, which have been generally alluded to as sets or…
Q: A batch of 2000 manufactured Items contains 200 defective items.If 10 items are selected at random…
A: From the provided information, A batch of 2000 manufactured items contain 200 defective items.…
Q: Learning in probability can take place not only in theoretical moments within a classroom, but also…
A:
Q: Suppose that scores on a particular test are normally distributed with a mean of 110 and a standard…
A: Given mean μ=110, standard deviation σ=15 Let X be the scores on a particular test are normally…
Q: Pulse rates (in bpm) were collected from a random sample of females who are non-smokers but do drink…
A: The pulse rates of a random sample of females who are non-smokers but do drink alcohol, are given.
Q: Use the data in the following table, which lists drive-thru order accuracy at popular fast food…
A: Given that, Drive-thru Restaurant A B C D Order Accurate 339 269 247 132…
Q: a. 1.8 b. 0.83 Assume that X has an exponential distribution. If Var (4-4)=20. Then E(X) is a. 20…
A: Result When X~exp(λ) Mean=√v(X)
1
Step by step
Solved in 2 steps with 2 images
- Find the equation of the regression line for the following data set. x 1 2 3 y 0 3 4The following fictitious table shows kryptonite price, in dollar per gram, t years after 2006. t= Years since 2006 0 1 2 3 4 5 6 7 8 9 10 K= Price 56 51 50 55 58 52 45 43 44 48 51 Make a quartic model of these data. Round the regression parameters to two decimal places.Olympic Pole Vault The graph in Figure 7 indicates that in recent years the winning Olympic men’s pole vault height has fallen below the value predicted by the regression line in Example 2. This might have occurred because when the pole vault was a new event there was much room for improvement in vaulters’ performances, whereas now even the best training can produce only incremental advances. Let’s see whether concentrating on more recent results gives a better predictor of future records. (a) Use the data in Table 2 (page 176) to complete the table of winning pole vault heights shown in the margin. (Note that we are using x=0 to correspond to the year 1972, where this restricted data set begins.) (b) Find the regression line for the data in part ‚(a). (c) Plot the data and the regression line on the same axes. Does the regression line seem to provide a good model for the data? (d) What does the regression line predict as the winning pole vault height for the 2012 Olympics? Compare this predicted value to the actual 2012 winning height of 5.97 m, as described on page 177. Has this new regression line provided a better prediction than the line in Example 2?
- For the following exercises, use Table 4 which shows the percent of unemployed persons 25 years or older who are college graduates in a particular city, by year. Based on the set of data given in Table 5, calculate the regression line using a calculator or other technology tool, and determine the correlation coefficient. Round to three decimal places of accuracyFor the following exercises, consider the data in Table 5, which shows the percent of unemployed in a city ofpeople25 years or older who are college graduates is given below, by year. 41. Based on the set of data given in Table 7, calculatethe regression line using a calculator or othertechnology tool, and determine the correlationcoefficient to three decimal places.For the following exercises, consider the data in Table 5, which shows the percent of unemployed ina city of people 25 years or older who are college graduates is given below, by year. 40. Based on the set of data given in Table 6, calculate the regression line using a calculator or other technology tool, and determine the correlation coefficient to three decimal places.
- Which of the following does not need to be computed to determine a simple regression line? SSx SP "Y-hat" SSyThe following estimated regression model was developed relating yearly income (y in $1000s) of 30 individuals with their age (x1) and their gender (x2) (0 if male and 1 if female).ŷ = 30 + 0.7x1 + 3x2Also provided are SST = 1200 and SSE = 384.The yearly income of a 24-year-old female individual is _____.The following estimated regression model was developed relating yearly income (y in $1000s) of 30 individuals with their age (x1) and their gender (x2) (0 if male and 1 if female).ŷ = 30 + 0.7x1 + 3x2Also provided are SST = 1200 and SSE = 384.The multiple coefficient of determination is _____.
- The following estimated regression equation based on 30 observations was presented. ŷ = 17.6 + 3.8x1 − 2.3x2 + 7.6x3 + 2.7x4 The values of SST and SSR are 1,808 and 1,780, respectively. (a) Compute R2. (b) Compute Ra2. (c) Comment on the goodness of fit.The following estimated regression equation is based on 30 observations. ŷ = 18.3 + 3.9x1 − 2.2x2 + 7.5x3 + 2.5x4 The values of SST and SSR are 1,805 and 1,762, respectively. a. Compute R2 = (to 3 decimals). b. Compute Ra2 = (to 3 decimals).A researcher conducted a number of descriptive statistics for two variables X and Y. They were as follows: SP = -20; SSx = 4; My = 7; Mx = 3 What is b equal to? What is a equal to? Using b and a construct a regression equation, and then using the regression equation, calculate the value of predicted Y when X = 2?