3. The following table is based on automobile accident records in 1988, supplied by the state of Florida Department of Highway Safety and Motor Vehicles. Subjects were classified by whether they were wearing a seat belt, whether ejected, and whether killed. injury Safety Equipment in Use Whether Ejected Nonfatal Fatal Seat belt Yes 1105 14 No 411111 4624 157342 483 None Yes 497 No 1008 Source Florida Department of Highway Safety and Motor Vehielas. (a) test and interpret the associations. Find a Loglinear model that describes the data well. Apply Chi-squared (b) According to AIC, which of these models seems best? Why?
3. The following table is based on automobile accident records in 1988, supplied by the state of Florida Department of Highway Safety and Motor Vehicles. Subjects were classified by whether they were wearing a seat belt, whether ejected, and whether killed. injury Safety Equipment in Use Whether Ejected Nonfatal Fatal Seat belt Yes 1105 14 No 411111 4624 157342 483 None Yes 497 No 1008 Source Florida Department of Highway Safety and Motor Vehielas. (a) test and interpret the associations. Find a Loglinear model that describes the data well. Apply Chi-squared (b) According to AIC, which of these models seems best? Why?

Glencoe Algebra 1, Student Edition, 9780079039897, 0079039898, 2018
18th Edition
ISBN:9780079039897
Author:Carter
Publisher:Carter
Chapter10: Statistics
Section10.6: Summarizing Categorical Data
Problem 27PPS

Related questions
Question
100%
Plz solve both parts in one hour and take a thumb up
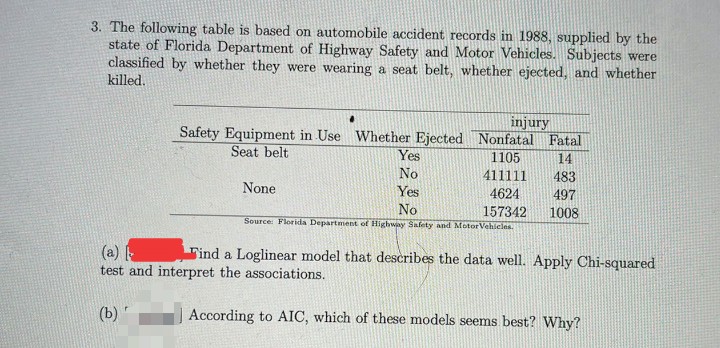
Transcribed Image Text:3. The following table is based on automobile accident records in 1988, supplied by the
state of Florida Department of Highway Safety and Motor Vehicles. Subjects were
classified by whether they were wearing a seat belt, whether ejected, and whether
killed.
injury
Safety Equipment in Use Whether Ejected Nonfatal Fatal
Yes
Seat belt
1105
14
No
Yes
411111
483
None
4624
497
No
Source: Florida Department of Highway Safety and MotorVehieles.
157342
1008
Find a Loglinear model that describes the data well. Apply Chi-squared
(a)
test and interpret the associations.
(b)
According to AIC, which of these models seems best? Why?
Expert Solution
This question has been solved!
Explore an expertly crafted, step-by-step solution for a thorough understanding of key concepts.

This is a popular solution!

Trending now
This is a popular solution!

Step by step
Solved in 2 steps with 1 images

Recommended textbooks for you
Glencoe Algebra 1, Student Edition, 9780079039897…
Algebra
ISBN:
9780079039897
Author:
Carter
Publisher:
McGraw Hill
Glencoe Algebra 1, Student Edition, 9780079039897…
Algebra
ISBN:
9780079039897
Author:
Carter
Publisher:
McGraw Hill