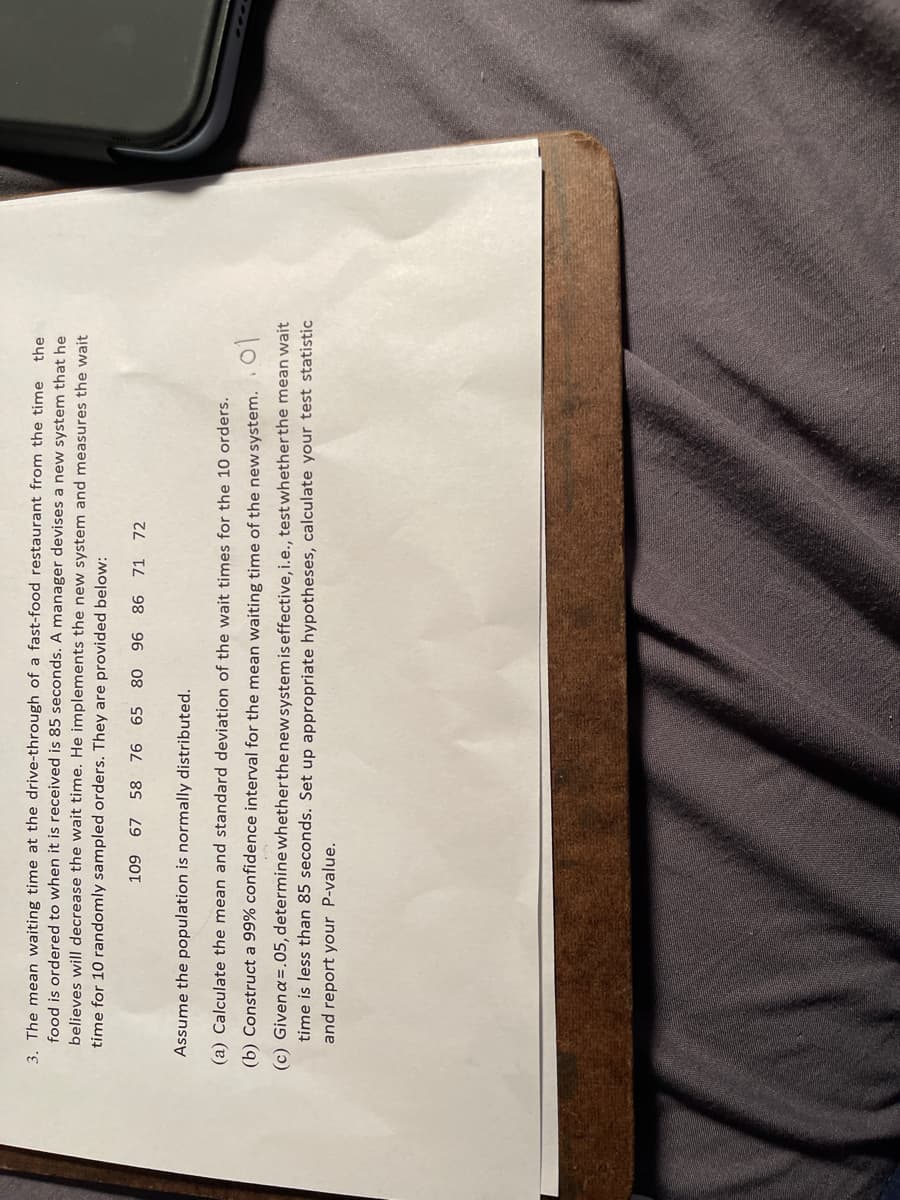
3. The mean waiting time at the drive-through of a fast-food restaurant from the time food is ordered to when it is received is 85 seconds. A manager devises a new system that he the believes will decrease the wait time. He implements the new system and measures the wait time for 10 randomly sampled orders. They are provided below: 109 67 58 76 65 80 96 86 71 72 Assume the population is normally distributed. (a) Calculate the mean and standard deviation of the wait times for the 10 orders. (b) Construct a 99% confidence interval for the mean waiting time of the new system. (c) Givena=.05, determine whetherthe newsystem iseffective, i.e., test whetherthe mean wait time is less than 85 seconds. Set up appropriate hypotheses, calculate your test statistic and report your P-value.


Inverse Normal Distribution
The method used for finding the corresponding z-critical value in a normal distribution using the known probability is said to be an inverse normal distribution. The inverse normal distribution is a continuous probability distribution with a family of two parameters.
Mean, Median, Mode
It is a descriptive summary of a data set. It can be defined by using some of the measures. The central tendencies do not provide information regarding individual data from the dataset. However, they give a summary of the data set. The central tendency or measure of central tendency is a central or typical value for a probability distribution.
Z-Scores
A z-score is a unit of measurement used in statistics to describe the position of a raw score in terms of its distance from the mean, measured with reference to standard deviation from the mean. Z-scores are useful in statistics because they allow comparison between two scores that belong to different normal distributions.


Trending now
This is a popular solution!

Step by step
Solved in 3 steps with 1 images


