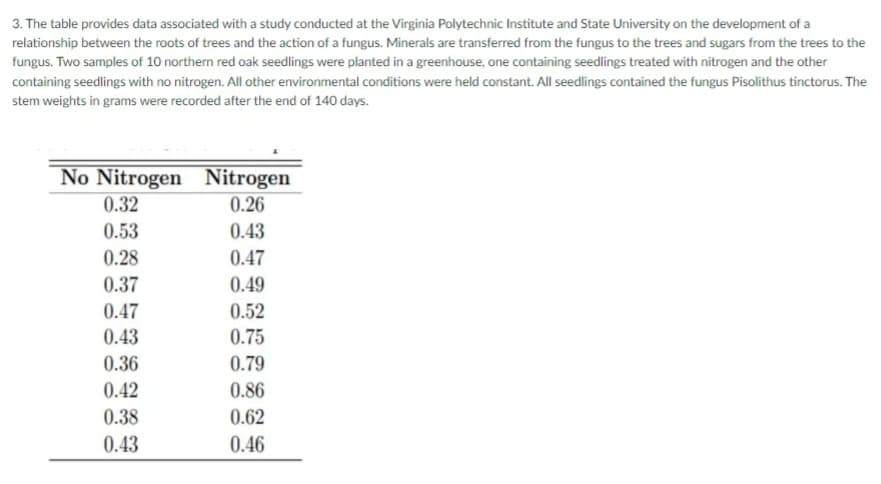
3. The table provides data associated with a study conducted at the Virginia Polytechnic Institute and State University on the development of a relationship between the roots of trees and the action of a fungus. Minerals are transferred from the fungus to the trees and sugars from the trees to the fungus. Two samples of 10 northern red oak seedlings were planted in a greenhouse, one containing seedlings treated with nitrogen and the other containing seedlings with no nitrogen. All other environmental conditions were held constant. All seedlings contained the fungus Pisolithus tinctorus. The stem weights in grams were recorded after the end of 140 days. No Nitrogen Nitrogen 0.32 0.26 0.53 0.43 0.28 0.47 0.37 0.49 0.47 0.52 0.43 0.75 0.36 0.79 0.42 0.86 0.38 0.62 0.43 0.46
Q: Assume that military aircraft use ejection seats designed for men weighing between 134.1 lb and 208 ...
A: Let X represents random variable which represents women's weight X ~ N(μ=166.5, σ2=47.32) (a)We hav...
Q: The test statistic is .
A: For pond 1 given data : 37.02,37.36,37.01,37.32,36.72,37.45,38.85
Q: 1st statement: tau provides a better value of rank correlation as it more related to rho 2nd stateme...
A: Answer: 1st statement is true, while second is false
Q: \B. Arrange the statements below step by step to compute for the probabilities and percentiles using...
A: NOTE :Here AS PER POLICY I HAVE CALCULATED FIRST MAIN QUESTION Here use basic steps of normal probab...
Q: 9. The following data represents the number of tornadoes per year in Oklahoma from 1995 until 2004. ...
A: Given Data 79 47 55 83 145 44 61 18 78 62
Q: A pizza place has pizzas in 2 different sizes, with 6 different flavors for the crust, and 10 differ...
A:
Q: A die is rolled twice. What is the probability of showing a 5 on the first roll and an even number o...
A: According to the given information, we have Given that a die is rolled twice.
Q: Fred recieved an SATV (SAT verbal) score of 610. For SATV scores we know u=500 and o=100 and that th...
A:
Q: If she calls 10 investors, what is the probability that exactly 6 will be interested to invest in he...
A: Let p be the probability that a investor invests in new technology. Given that p = 0.183 Let X denot...
Q: Find the area of the shaded region. The graph to the right depicts IQ scores of adults, and those sc...
A:
Q: TRUE OR FALSE. a. Pearson correlation coefficient is an example of a non-parametric test. b. Thoug...
A: a) False
Q: 1. A career counselor claims in Career Development Quarterly that there is no difference in career d...
A: F
Q: Which category of heights represents the mode?
A: We have to determine the modal class i.e class in which mode lies.
Q: 4. A study was conducted to test diastolic blood pressure readings between patients with sedentary l...
A: The data of two groups A and B's diastolic blood pressure readings are given as: Group A Group B ...
Q: 2. vo dice are tossed 65 times and the sums of the numbers are corded in the table. Draw a bar graph...
A:
Q: Which of the following are assumptions on the use of paired t-test? a. There is a relationship betw...
A: Paired t test is used to measure the mean significance between the two paired sample. In which the t...
Q: Probability For each observation pair Example 5-31. A random observation on bivariate population (X,...
A:
Q: There are four blood types, and not all are equally likely to be in blood banks. In a certain blood ...
A: In certain blood bank, there are four types of blood which are not equally likely to be available in...
Q: A population has a mean of 1398.25 and standard deviation of 246.85 17 The middle interval that ...
A: GivenMean(μ)=1398.25standard deviation(σ)=246.85sample size(n)=82
Q: Which of the following correlation (r) show a negative association between 2 variables?
A: The correlation coefficient r shows the strength and direction of the linear relationship between tw...
Q: Researchers conducted a survey among 400 doctors to ask the question; "Are you willing to treat your...
A: Given Sample size, n = 400 For a conservative case, we assume that the proportion of patients answ...
Q: Below is an excerpt from the Standard Normal Distribution Table. z 0.00 0.01 0.02 0.03 0.04 0.05 0....
A: Required probability is P(Z<-0.45)
Q: negatively associated in each of the following cases : Find if A and B are independent, positively a...
A:
Q: The take-home salary (in kwacha) of 30 unskilled workers from a company for a particular month was ...
A:
Q: The following contingency table shows the results of a car dealership's recent survey, recording the...
A: Given Ford Toyota VW TOTAL MEN 15 10 13 38 WOMEN 16 10 10 36 TOTAL 31 20 23 74
Q: How can predictive modeling be used to determine future customer churn? Using Rattle
A: Given information: It is required to state how predictive modelling can be used to determine future ...
Q: Take the following scores from an interval scale and create a frequency table with all appropriate c...
A: For the Given data, create a frequency table with all appropriate columns
Q: 8 + 7(42 - 3)
A: 8 + 7(42 - 3) = ?
Q: Suppose 10 people are potential candidate of a conference (the number of people invited to the confe...
A: From 6 graduate student 4 can be selected in 6C4 ways, and for undergrad students they can come with...
Q: Two samples of scores on a survey are as follows: Sample A: 10 7 6 Sample B: 183 10 112 7 28. What i...
A:
Q: Consider an equation to explain salaries of CEOS in terms of annual firm sales, return on equity (ro...
A: 2. Consider, The coefficient of roe is 0.0174. Given that the value of roe changes by 10 percentage...
Q: A study of the ages of 100 person's grouped into intervals 20-22, 22-24, 24-26....., revealed the me...
A: Given Mean=μ=32.02, standard deviation=σ=13.18, n=100
Q: Smooth Rhythm 12 13 15 10 Standard 11 14 Use the Venn Diagram to determine the following probabiliti...
A: For the venn diagram P(Rhythm/smooth) = ? P(Rhythm/standard) = ? P(standard/Rhythm) = ? P(Rhythm/smo...
Q: 3. A measure of the right atrial pressure (mm Hg) was made for cardiac patients who were given Capto...
A: Sample sizes n1=21 , n2=21 Sample means X̄1=7.8 , X̄2=6.6 s1 =1.44 ...
Q: Find the missing information from the following : Group I Group II Group III Combined Number 50 90 2...
A: Given that We have to find missing values :
Q: A courier service claims that only 5 % of all of its deliveries arrive late. Assuming deliveries are...
A:
Q: The spending in dollars of 26551 customers in one marketing segment of a credit card company, during...
A: Given, The spending in dollars of 26551 customers in one marketing segment of a credit card company ...
Q: A study is run to evaluate the effectiveness of an exercise program in reducing systolic Ate blood p...
A: For the given research objective we need to tell which is the most appropriate statistical test to b...
Q: Determine the following probabilities. Write your answers as reduced fractions. P(sum is odd) = ?...
A:
Q: What is the probability that it takes 7 people to find the first person who supports the referendum?...
A: Given : In a certain town, 45% of the voters support a school referendum up for a vote.
Q: TRUE OR FALSE. a. tau in rank correlation of ordinal data is best used when there are a few number ...
A: a) The statement "a. tau in rank correlation of ordinal data is best used when there are a few numbe...
Q: The random variable x represents the number of phone calls an author receives in a day, and it has a...
A:
Q: The graduate record examination is a standardized test that students usually take before entering gr...
A:
Q: A math class consists of 22 female students and 10 male students. Two students are selected at rando...
A: Given math class consists of 22 female students and 10 male students. Total=32
Q: 2.44 Cat weights: The histogram shown below represents the weights (in kg) of 47 female and 97 male ...
A:
Q: At a drug rehab center 34% experience depression and 29% experience weight gain. 16% experience both...
A: As per guidelines expert have to answer first question three subparts only dear student please uploa...
Q: Do a uniformity test of the calculated numbers by following the instruction below. [consider your st...
A: Null Hypothesis: H0: The random numbers are uniformly distributed between 0 and 1. Alternative Hypot...
Q: take the following scores from an interval scale and create a frequency table with all the appropria...
A: For the given data create a frequency table with all the appropriate columns
Q: Explain the meaning of a Type I error. A) Concluding that u> 19.2 hours when in fact u = 19.2 hours ...
A: Here use definition of type 1 error
Q: A population has a mean of 1398.25 and standard deviation of 246.85 18 Now keep the error probab...
A: formula for the sample size is
Trending now
This is a popular solution!
Step by step
Solved in 2 steps
- 2. Suppose that in Example 2.27, 400 units of food A, 500 units of B, and 600 units of C are placed in the test tube each day and the data on daily food consumption by the bacteria (in units per day) are as shown in Table 2.7. How many bacteria of each strain can coexist in the test tube and consume all of the food? Table 2.7 Bacteria Strain I Bacteria Strain II Bacteria Strain III Food A 1 2 0 Food B 2 1 3 Food C 1 1 15. A consumer buying cooperative tested the effective heating area of 20 different electric space heaters with different wattages. Here are the results. Heater Wattage Area 1 750 291 2 1,750 83 3 1,250 215 4 1,750 209 5 1,500 295 6 750 153 7 1,000 40 8 750 166 9 1,250 115 10 1,250 146 11 750 113 12 1,000 56 13 1,750 284 14 1,000 45 15 750 82 16 1,250 175 17 750 150 18 1,500 231 19 1,000 87 20 750 52 Click here for the Excel Data FileRequired:a. Compute the correlation between the wattage and heating area. Is there a direct or an indirect relationship? (Round your answer to 4 decimal places.) b. Conduct a test of hypothesis to determine if it is reasonable that the coefficient is greater than zero. Use the 0.050 significance level. (Round intermediate calculations and final answer to 3 decimal places.)H0: ρ ≤ 0; H1: ρ > 0 Reject H0 if t > 1.734…Here are some data I found on the enzyme activity of mannose-6-phosphate isomerase (MPI) and MPI genotypes in the amphipod crustacean Platorchestia platensis. Because I didn't know whether sex also affected MPI activity, I separated the amphipods by sex. F and S stand for fast and slow respectively, and have to do with electrophoretic mobility on an agarose gel. FF, FS, and SS then reflect genotypes with FS being the heterozygote. Consider the numbers to be activity units. Analysis these data with the appropriate two-way ANOVA and state your conclusions below. Genotype Female Male FF 2.838 1.884 4.216 2.283 2.889 4.939 4.198 3.486 FS 3.55 2.396 4.556 2.956 3.087 3.105 1.943 2.649 SS 3.62 2.801 3.079 3.421 3.586 4.275 2.669 3.11 I use excel for this question
- ch 11. 4 Oxnard Petro, Ltd., has three interdisciplinary project development teams that function on an ongoing basis. Team members rotate from time to time. Every 4 months (three times a year) each department head rates the performance of each project team (using a 0 to 100 scale, where 100 is the best rating). Are the main effects significant? Is there an interaction?Suppose that the index model for two Canadian stocks HD and ML is estimated with the following results: RHD =-0.03+2.10RM+eHD R-squared =0.7 RML =0.06+1.60RM+eML R-squared =0.6 σM =0.15 where M is S&P/TSX Comp Index and RX is the excess return of stock X. What is the covariance and the correlation coefficient between HD and ML?4) Here are data on the lengths of male and female roaches (in mm). Your job is to find out if there is adifference between male and female roaches (this should be two sided - why?).males 15.4 13.9 12.7 9.6 6.6 10.7 9.9 13.3 16.2 9.0 11.4 16.6 12.2females 16.7 16.3 12.8 16.9 15.1 12.8 18.7 18.3 8.6 13.6 15.3 16.2 13.4It's up to you to figure out what the best procedure is, what kind of hypotheses to use, which α to use,what test to use, and so on. Make sure you follow all the appropriate steps. You should probably use Ras you’ll get done much quicker. Remember to very clearly state your results in writing. Never turn in just an R printout .Hint: how do you decide which test to use? What kind of distributions do the data have?
- A dietitian wishes to see if a person’s cholesterol level will be changed if the diet is supplemented by a certain mineral. Four subjects were pre-tested, and they took the mineral supplement for a 6-week period. The results are shown in the table. Is there sufficient evidence to conclude that the population mean of cholesterol levels has been changed after six weeks at α=0.2α=0.2? Assume that the differences are from an approximately normally distributed population. Subject Cholestrol Level (mg/dl) Cholestrol Level after 6 Weeks (mg/dl) dd ¯dd¯ (d−¯d)2(d-d¯)2 1 206 217 11 2 219 184 -35 3 202 204 2 4 213 205 -8 Total -30 a) Calculate the mean, the sum of the squared deviation from the mean, and the standard deviation of differences. Do not include the unit for each answer: ¯d=d¯= (do not round) ∑(d−¯d)2=∑(d-d¯)2= (do not round) sd=sd= (rounded to one decimal place) b) Perform the hypothesis test in the following steps: Step 1.…Suppose that the index model for two Canadian stocks HD and ML is estimated with the following results: RHD =-0.03+2.10RM+eHD R-squared =0.7 RML =0.06+1.60RM+eML R-squared =0.6 σM =0.15 where M is S&P/TSX Comp Index and RX is the excess return of stock X. What is the covariance and the correlation coefficient between HD and ML? For portfolio P with investment proportion of 0.4 in HD and 0.6 in ML, calculate the systematic risk, non-systematic risk, and total risk of P.4)The following is an experiment I have designed to analyze the effects of battery type and ambient temperature on the power output of handheld blue lasers. A laser is powered with either standard alkaline batteries, lithium ion batteries, or rechargeable nickel hydride batteries. For simplicity, just call these batteries Type 1, Type 2, and Type 3. Different lasers are run with ambient temperature set at either 60 degrees, 70 degrees, or 80 degrees Fahrenheit. (a) What is the response variable in this experiment? (b) What are the factors in this experiment?(c) List the levels of each factor(d) How many possible treatments can be created in this experiment?(e) List four possible treatments (you do not need to list all of the treatments).
- Suppose we want to predict job performance of Chevy mechanics based on mechanical aptitude test scores and test scores from personality test that measures conscientiousness. mech aptitude conscientiousness job performance x1 x2 y 40 25 1 45 20 2 38 30 1 50 30 3 48 28 2 55 30 3 53 34 3 55 36 4 58 32 4 40 34 3 55 38 5 48 28 3 45 30 3 55 36 2 60 34 4 60 38 5 60 42 5 65 38 5 50 34 4 58 38 3 Please use excel to find a line to minimize the absolute deviation. It is fine if you do not need to write down the formulation, but please print out the excel solutions and find the coefficients a1,a2, b of the line:y= a1 x1+ a2 x2+ bFor some genetic mutations, it is thought that the frequency of the mutant gene in men increases linearly with age. If m1 is the frequency at age t1, and m2 is the frequency at age t2, then the yearly rate of increase is estimated by r = (m2 − m1)/(t2 − t1). In a polymerase chain reaction assay, the frequency in 20-year-old men was estimated to be 17.7 ± 1.7 per μgDNA, and the frequency in 40-year-old men was estimated to be 35.9 ± 5.8 per μg DNA. Assume that age is measured with negligible uncertainty.a) Estimate the yearly rate of increase, and find the uncertainty in the estimate.b) Find the relative uncertainty in the estimated rate of increase.In a typical multiple linear regression model where x1 and x2 are non-random regressors, the expected value of the response variable y given x1 and x2 is denoted by E(y | 2,, X2). Build a multiple linear regression model for E (y | *,, *2) such that the value of E(y | x1, X2) may change as the value of x2 changes but the change in the value of E(y | X1, X2) may differ in the value of x1 . How can such a potential difference be tested and estimated statistically?