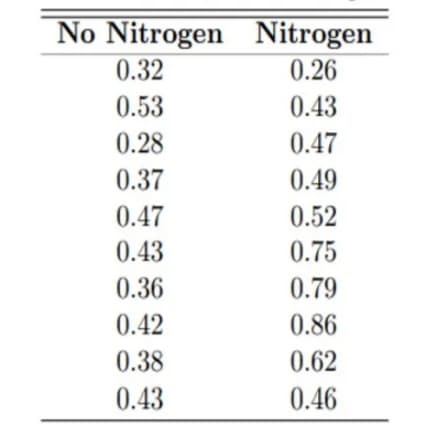
3. The table provides data associated with a study conducted at the Virginia Polytechnic Institute and State University on the development of a relationship between the roots of trees and the action of a fungus. Minerals are transferred from the fungus to the trees and sugars from the trees to the fungus. Two samples of 10 northern red oak seedlings were planted in a greenhouse, one containing seedlings treated with nitrogen and the other containing seedlings with no nitrogen. All other environmental conditions were held constant. All seedlings contained the fungus Pisolithus tinctorus. The stem weights in grams were recorded after the end of 140 days.


Q: In a trend and seasonality corrected exponential smoothing model explain what alpha, beta and gamma ...
A:
Q: Frank Catton, the general manager of Billybob's floating raft hotel and casino in Tunica Mississippi...
A:
Q: Researchers constructed a confidence interval for the mean body temperature of healthy US adults, us...
A: Definition of confidence interval: Were this procedure to be repeated on numerous samples, the propo...
Q: You are taking a quiz that has 10 multiple-choice questions. If each question has 3 possible answers...
A:
Q: Roll two fair dice. Use the Poisson approximation to find the probability that you will roll at leas...
A: Given that two dice are rolled, then total no. of out comes are 36, let p be the probability of doub...
Q: There are four blood types, and not all are equally likely to be in blood banks. In a certain blood ...
A: In certain blood bank, there are four types of blood which are not equally likely to be available in...
Q: Find an example of something IN REAL LIFE that you would not expect to be normally distributed and s...
A: We should find an example of something that you would not expect to be normally distributed.
Q: Fred recieved an SATV (SAT verbal) score of 610. For SATV scores we know u=500 and o=100 and that th...
A:
Q: For the data 69.65, 69.63, 69.64, 69.21, calculate the 95% confidence limit. (A) 69.6 ± 0.5 B 69.7 +...
A: Given data is69.65 , 69.63 , 69.64 , 69.21sample size(n)=4sample mean(x¯)=69.65+69.63+69.64+69.214sa...
Q: Claire flips a coin 4 times. Using the table, what is the probability that the coin will show tails ...
A: We use the given probability distribution table to find the required probability.
Q: A population has a mean of 1398.25 and standard deviation of 246.85 13 The margin of error for t...
A: A population has a mean of 1398.25 and standard deviation of 246.85
Q: The game of American roulette involves spinning a wheel with 38 slots: 18 red, 18 black, and 2 green...
A: If the probability of getting selected for each outcome is equal then such outcomes can be termed as...
Q: If only lottery A is available at price 45, should you buy it? If only lottery B is available at pri...
A:
Q: 1. A test consist of 5 multiple choice questions with 4 choices each followed by 5 true-false questi...
A:
Q: For the data 69.65, 69.63, 69.64, 69.21, calculate the 95% confidence limit
A:
Q: a. If F VE, then E F.
A: a. If F→E then E→F Therefore, P(E|F)=P(E∩F)P(F)≤P(E) P(E∩F)≥p(E)*P(F)
Q: Do a uniformity test of the calculated numbers by following the instruction below. [consider your st...
A: Null Hypothesis: H0: The random numbers are uniformly distributed between 0 and 1. Alternative Hypot...
Q: O number of household members QUESTION 11 Three board members for a hospital will be selected from a...
A: Given, Three board members for a hospital will be selected from a group of five people. The name...
Q: Juan owns 4 pairs of pants, 6 shirts, 1 ties, and 3 jackets. How many different outfits can he wear ...
A:
Q: The test statistic is .
A: For pond 1 given data : 37.02,37.36,37.01,37.32,36.72,37.45,38.85
Q: The following scores represent the final examination grade for an elementary statistics 23 60 79 32 ...
A: Concentration of all the values around the central value of the given data is known as measures of c...
Q: An airplane manufacturer sells at most 1 airplanes per month. If the company is expected to sell 0.7...
A: Given airplane manufacturer sells 0 or 1 airplanes per month. If the company is expected to sell 0....
Q: A community college employs &85 full-time faculty members. To gain the faculty's opinions about an u...
A: Given, There are 85 factuly members in a college. To gain the faculty opinion on upcoming building p...
Q: Does the interval above provide evidence that more than 60% of northern Kentucky residents are oppos...
A: Given : A 2013 survey of 1692 northern Kentucky AAA members was asked their opinion on instituting a...
Q: The manager of a computer help desk operation in Moncton has collected enough data to conclude that ...
A: We have given that, Let X be the random variable from normal distribution with mean call time μ, st...
Q: The following binary data represent the students taking a statistics course in a major university, w...
A: Introduction: Denote p̂ as the sample proportion of students represented by “1”, that is, for studen...
Q: Parida (1991) gives data from a load-controlled high-cycle fatigue test conducted on 130 chain links...
A: see the explanation.....
Q: Which of the following statistical test is most appropriate to use in order to determine the relatio...
A: In the given problem we have to answer the question of, Which of the statistical test is most approp...
Q: About _% of the area is between z = - 2 and z = 2 (or within 2 standard deviations of the mean). Abo...
A: 95.45%
Q: A common design requirement is that an environment must fit the range of people who fall between the...
A: as per our company guidelines we are supposed to answer only first part. Kindly repost other parts i...
Q: For this activity, identify the independent (or quasi-independent) and dependent variables in the fo...
A:
Q: The heights (in inches) of 30 adult males are listed below. A frequency distribution show the freque...
A: We want to tell you which one is the correct choice.
Q: 90% confidence interval for the difference in mean number of species between unlogged and logged plo...
A: Given: Unlogged forest: 22 18 22 20 15 21 13 13 19 13 19 15 Logged forest: 17 4 18 14 18 15 15 10 1...
Q: Given the class interval 78.49 – 85.72, the class mark is _____ , the class size is ______ and the c...
A:
Q: A common design requirement is that an environment must fit the range of people who fall between the...
A:
Q: 1st statement: rho in rank correlation of ordinal data is best used when there are a few number of s...
A: The given statements are: 1) rho in rank correlation of ordinal data is best used when there are a f...
Q: Which of the following processes (Xt)t is weakly stationary? A: Xt = 1:6 + Xt 1 + V t B: Xt = 0:6 X...
A: Weakly stationary: A random process is said to be weakly stationary if the mean of the process is in...
Q: Activity 1: Draw Where I Am Directions: Find the area under the normal curve in each of the followin...
A: (1) Obtain the area under the normal curve to the right of Z=–0.76. The area under the normal curve ...
Q: Find the probability distribution for the number of heads that occur when 4 coins are tossed. Find ...
A: Given that Number of coins tossed (n) = 4 We know that Probability = Number of favorable eventsT...
Q: You have a coin that is not weighted evenly and therefore is not a fair coin. Assume the true probab...
A: Solution-: Given: p=0.55,n=66 We find, (a) μp^=? (b) σp^=? (c) σp^2=?
Q: Mary Poppins Nanny Service wants to find out if the nannies in their five Tampa branches are working...
A: Note: Hi there! Thank you for posting the questions. As there are several independent questions, acc...
Q: Beer bottles are filled so that they contain an average of 330 ml of beer in each bottle. The amount...
A: GivenMean(μ)=330standard deviation(σ)=2.9
Q: The multivariate analysis considers more than one factor of independent variables that influence the...
A: Regression model is used to predict or forecast future value keeping certain factors constant. An e...
Q: TRUE OR FALSE. a. whenever possible, it is best to use the coefficient rho in rank correlation than...
A: We have given the two statements. We need to tell if they are True or False.
Q: Suppose the average math SAT score for students enrolled at Madison College is 507.3 with a standard...
A:
Q: a. rho in rank correlation of ordinal data is best used when there are a few number of samples. b. ...
A: a) The statement, "rho in rank correlation of ordinal data is best used when there are a few number ...
Q: Investigating the relationship between two ranked variables and determining the strength and directi...
A: statement: Investigating the relationship between two ranked variables and determining the strength...
Q: A survey found that women's heights are normally distributed with mean 63.2 in. and standard deviati...
A: GivenWomen's height are normally distributedMean(μ)=63.2standard deviation(σ)=2.1Men's height are no...
Q: Each item produced by a certain manufacturer is, independently, of acceptable quality with probabili...
A: * SOLUTION :- From the given information the calculation is given as below
Q: On a freeway 85% of vehicles violate the speed limit (π = 0.85). From the population of all vehicles...
A: On a freeway 85% of vehicles violate the speed limit (π = 0.85). From the population of all ve...


Step by step
Solved in 2 steps

- 2. Suppose that in Example 2.27, 400 units of food A, 500 units of B, and 600 units of C are placed in the test tube each day and the data on daily food consumption by the bacteria (in units per day) are as shown in Table 2.7. How many bacteria of each strain can coexist in the test tube and consume all of the food? Table 2.7 Bacteria Strain I Bacteria Strain II Bacteria Strain III Food A 1 2 0 Food B 2 1 3 Food C 1 1 1Suppose that the index model for two Canadian stocks HD and ML is estimated with the following results: RHD =-0.03+2.10RM+eHD R-squared =0.7 RML =0.06+1.60RM+eML R-squared =0.6 σM =0.15 where M is S&P/TSX Comp Index and RX is the excess return of stock X. What is the covariance and the correlation coefficient between HD and ML?1) The following data show the results of a study based on the number of hours college students spend playing video games and their GPAs: Number of Hours Playing Video Games(per week)= 42 GPA= 0.2Number of Hours Playing Video Games(per week)= 38 GPA= 0.9Number of Hours Playing Video Games(per week) = 32 GPA= 1.0Number of Hours Playing Video Games(per week) = 26 GPA = 1.1Number of Hours Playing Video Games(per week) = 23 GPA= 1.2Number of Hours Playing Video Games(per week) = 19 GPA= 2.5Number of Hours Playing Video Games(per week) = 15 GPA = 3.0 a) Create a scatter plot and be sure to LABEL BOTH axis and give the chart an overall name. Have the graph display the “r-value” and the correct equation.b) What kind of correlation is this?c) Is this more of a linear or exponential model? Why?d) Predict the standard GPA if a student spends one hour a week playing videogames.
- 5. A consumer buying cooperative tested the effective heating area of 20 different electric space heaters with different wattages. Here are the results. Heater Wattage Area 1 750 291 2 1,750 83 3 1,250 215 4 1,750 209 5 1,500 295 6 750 153 7 1,000 40 8 750 166 9 1,250 115 10 1,250 146 11 750 113 12 1,000 56 13 1,750 284 14 1,000 45 15 750 82 16 1,250 175 17 750 150 18 1,500 231 19 1,000 87 20 750 52 Click here for the Excel Data FileRequired:a. Compute the correlation between the wattage and heating area. Is there a direct or an indirect relationship? (Round your answer to 4 decimal places.) b. Conduct a test of hypothesis to determine if it is reasonable that the coefficient is greater than zero. Use the 0.050 significance level. (Round intermediate calculations and final answer to 3 decimal places.)H0: ρ ≤ 0; H1: ρ > 0 Reject H0 if t > 1.734…1.1 Find the independent nonlinearity and the correlation coefficient for the following set of inputs and outputs from a nearly linear system. Instrument was designed for an output equal to twice the input. Full scale is 20. Input 0.50 1.50 2.00 5.00 10.00 Output 0.90 3.05 4.00 9.90 20.50Here are some data I found on the enzyme activity of mannose-6-phosphate isomerase (MPI) and MPI genotypes in the amphipod crustacean Platorchestia platensis. Because I didn't know whether sex also affected MPI activity, I separated the amphipods by sex. F and S stand for fast and slow respectively, and have to do with electrophoretic mobility on an agarose gel. FF, FS, and SS then reflect genotypes with FS being the heterozygote. Consider the numbers to be activity units. Analysis these data with the appropriate two-way ANOVA and state your conclusions below. Genotype Female Male FF 2.838 1.884 4.216 2.283 2.889 4.939 4.198 3.486 FS 3.55 2.396 4.556 2.956 3.087 3.105 1.943 2.649 SS 3.62 2.801 3.079 3.421 3.586 4.275 2.669 3.11 I use excel for this question
- ch 13. 5: Cincinnati Paint Company sells quality brands of paints through hardware stores throughout the United States. The company maintains a large sales force who call on existing customers and look for new business. The national sales manager is investigating the relationship between the number of sales calls made and the miles driven by the sales representative. Also, do the sales representatives who drive the most miles and make the most calls necessarily earn the most in sales commissions? To investigate, the vice president of sales selected a sample of 25 sales representatives and determined: The amount earned in commissions last month (y) The number of miles driven last month (x1) The number of sales calls made last month (x2) The information is reported below. Commissions ($000) Calls Driven Commissions ($000) Calls Driven 29 139 2,371 27 146 3,290 26 132 2,226 25 144 3,103 28 144 2,731 29 147 2,122 26 142 3,351 25 144 2,791 29 142 2,289 25 149 3,209 28…Suppose you have been employed by ALADIN Solutions Ltd. as an Operations Manager to study the efficiency of customer service center of SONE Bank in handling customers. The customer service center has two serving points, Alpha and Bravo, through which customers are catered. Your field survey results are presented in Table 1 as follows: Table 1: Wait time of Service Points in Minutes Customer No. Alpha Bravo 1 12 10 2 16 3 3 11 8 4 10 7 5 17 6 6 10 16 7 13 15 8 18 16 9 6 20 10 17 9 You are required to write a letter to your supervisor for presenting the results of your analysis. Use mean waiting times and box plots as the tools to compare the efficiency of Alpha and Bravo serving points. Assuming a customer visits Alpha and Bravo points and is handled in 18 minutes. Which point is handling customer better? Use Z-Score to determine this and incorporate the results in your letter.This is a multipart question 6.) Diesel Dave has modified his massive truck to combat global cooling, and to roll coal on his neighbor Environmentalist Ed. With each blast of diesel exhaust fumes, Diesel Dave releases sulfur dioxide in a giantblack cloud. Every morning as Diesel Dave is leaving home he rolls coal into Environmentalist Ed's yard. Not surprisingly, Environmentalist Ed is diligently collecting data on the air quality in his yard. Suppose Diesel Davereleases sulfur dioxide in a normally distributed manner with a mean of 2800 ppm and a standard deviation of 120 ppm. What is the probability that on a random morning he will release sulfur dioxide greater than 3000ppm? Suppose in order to sue Diesel Dave, Environmentalist Ed needs the daily average level of sulfur dioxide emissions to exceed 3000 ppm. However, he can choose to take his mean measurement over 2, 3, or 15 days. Which number of days would maximize Environmentalist Edís chances of suing Diesel Dave? (Hint: What…
- A dietitian wishes to see if a person’s cholesterol level will be changed if the diet is supplemented by a certain mineral. Four subjects were pre-tested, and they took the mineral supplement for a 6-week period. The results are shown in the table. Is there sufficient evidence to conclude that the population mean of cholesterol levels has been changed after six weeks at α=0.2α=0.2? Assume that the differences are from an approximately normally distributed population. Subject Cholestrol Level (mg/dl) Cholestrol Level after 6 Weeks (mg/dl) dd ¯dd¯ (d−¯d)2(d-d¯)2 1 206 217 11 2 219 184 -35 3 202 204 2 4 213 205 -8 Total -30 a) Calculate the mean, the sum of the squared deviation from the mean, and the standard deviation of differences. Do not include the unit for each answer: ¯d=d¯= (do not round) ∑(d−¯d)2=∑(d-d¯)2= (do not round) sd=sd= (rounded to one decimal place) b) Perform the hypothesis test in the following steps: Step 1.…European City Change in Hotel Costs U.S. City Change in Hotel Costs Ljubljana -0.009 Birmingham 0.074 Hotel prices worldwide are projected to increase by 3% next year, but is there a difference between Europe and US? Suppose we have projectd changes in hotels cost for 47 randomly selected major European cities and 53 randomly selected major American Cities. Geneva 0.000 Pittsburgh 0.089 Zagreb 0.060 Indianapolis -0.013 Stockholm 0.041 Norfolk 0.070 Tirana 0.082 Boston 0.077 Riga 0.076 Winston-Salem 0.074 Istanbul 0.021 Stockton 0.021 Bucharest 0.073 Laredo 0.024 Budapest 0.045 Corpus Christi 0.088 Part a Minsk 0.023 Portland 0.020 On the basis of the sample results, can we conclude that the mean change in hotels rates in Europe and US are different ? Develop appropriate null and alternative hypotheses. Rome 0.033 St. Paul 0.061 Antwerp 0.012 Memphis 0.086 Reykjavik -0.002 Virginia Beach 0.052 Düsseldorf 0.044…This exercise requires the use of technology.Four sectors of the U.S. economy are (1) livestock and livestock products, (2) other agricultural products, (3) forestry and fishery products, and (4) agricultural, forestry, and fishery services. Suppose that in 1977 the input-output table involving these four sectors was as follows (all figures are in millions of dollars).Determine how these four sectors would react to an increase in demand for livestock (Sector 1) of $1,000 million, how they would react to an increase in demand for other agricultural products (Sector 2) of $1,000 million, and so on. (Round your answers to two decimal places. Let the columns of the matrix be given in millions of dollars.) To 1 2 3 4 From 1 11,937 9 109 855 2 26,649 4,285 0 4,744 3 0 0 439 61 4 5,423 10,952 3,002 216 Total Output 97,795 120,594 14,642 47,473