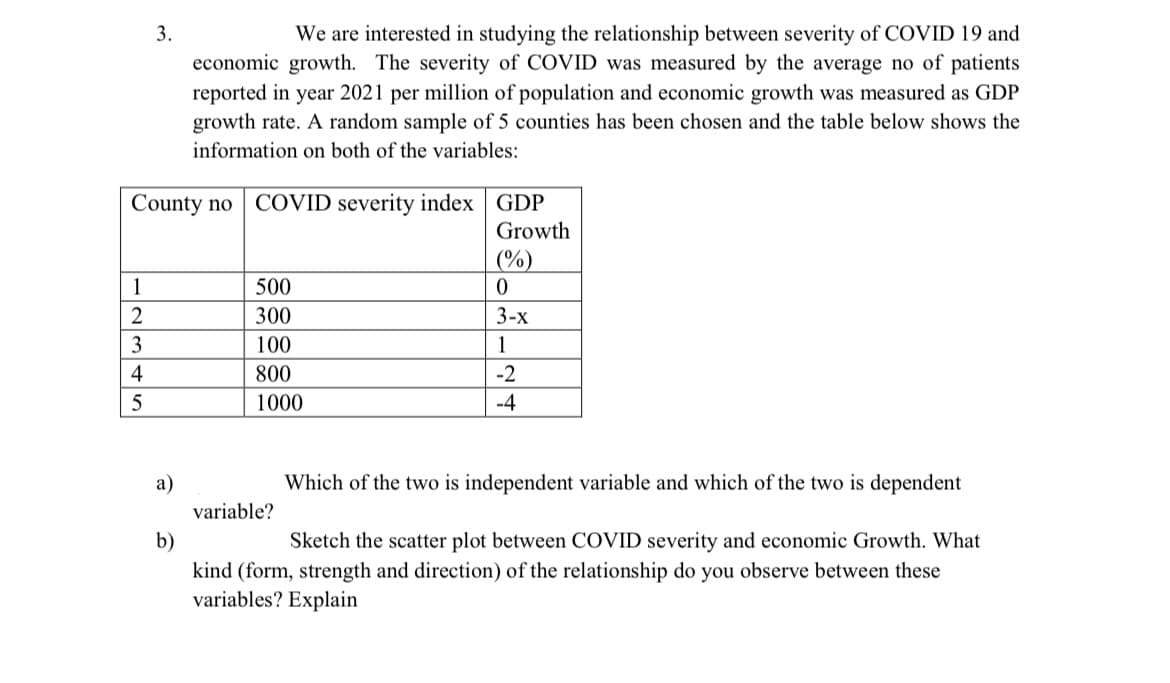
3. We are interested in studying the relationship between severity of COVID 19 and economic growth. The severity of COVID was measured by the average no of patients reported in year 2021 per million of population and economic growth was measured as GDP growth rate. A random sample of 5 counties has been chosen and the table below shows the information on both of the variables: County no COVID severity index GDP Growth (%) 1 500 2 300 3-х 3 100 1 4 800 -2 5 1000 -4 a) Which of the two is independent variable and which of the two is dependent variable? b) kind (form, strength and direction) of the relationship do you observe between these variables? Explain Sketch the scatter plot between COVID severity and economic Growth. What
3. We are interested in studying the relationship between severity of COVID 19 and economic growth. The severity of COVID was measured by the average no of patients reported in year 2021 per million of population and economic growth was measured as GDP growth rate. A random sample of 5 counties has been chosen and the table below shows the information on both of the variables: County no COVID severity index GDP Growth (%) 1 500 2 300 3-х 3 100 1 4 800 -2 5 1000 -4 a) Which of the two is independent variable and which of the two is dependent variable? b) kind (form, strength and direction) of the relationship do you observe between these variables? Explain Sketch the scatter plot between COVID severity and economic Growth. What
Linear Algebra: A Modern Introduction
4th Edition
ISBN:9781285463247
Author:David Poole
Publisher:David Poole
Chapter7: Distance And Approximation
Section7.3: Least Squares Approximation
Problem 31EQ
Related questions
Question

Transcribed Image Text:We are interested in studying the relationship between severity of COVID 19 and
economic growth. The severity of COVID was measured by the average no of patients
reported in year 2021 per million of population and economic growth was measured as GDP
growth rate. A random sample of 5 counties has been chosen and the table below shows the
3.
information on both of the variables:
County no COVID severity index GDP
Growth
(%)
1
500
2
300
3-х
3
100
1
4
800
-2
1000
-4
a)
Which of the two is independent variable and which of the two is dependent
variable?
b)
kind (form, strength and direction) of the relationship do you observe between these
variables? Explain
Sketch the scatter plot between COVID severity and economic Growth. What
Expert Solution
This question has been solved!
Explore an expertly crafted, step-by-step solution for a thorough understanding of key concepts.
Step by step
Solved in 3 steps with 1 images

Recommended textbooks for you

Linear Algebra: A Modern Introduction
Algebra
ISBN:
9781285463247
Author:
David Poole
Publisher:
Cengage Learning

Glencoe Algebra 1, Student Edition, 9780079039897…
Algebra
ISBN:
9780079039897
Author:
Carter
Publisher:
McGraw Hill

Big Ideas Math A Bridge To Success Algebra 1: Stu…
Algebra
ISBN:
9781680331141
Author:
HOUGHTON MIFFLIN HARCOURT
Publisher:
Houghton Mifflin Harcourt

Linear Algebra: A Modern Introduction
Algebra
ISBN:
9781285463247
Author:
David Poole
Publisher:
Cengage Learning

Glencoe Algebra 1, Student Edition, 9780079039897…
Algebra
ISBN:
9780079039897
Author:
Carter
Publisher:
McGraw Hill

Big Ideas Math A Bridge To Success Algebra 1: Stu…
Algebra
ISBN:
9781680331141
Author:
HOUGHTON MIFFLIN HARCOURT
Publisher:
Houghton Mifflin Harcourt