3. Which of the following is the most appropriate graph to compare the distribution of calorie intake of women who weigh more than 50 kg and of those who weigh below 50kg? OA. histogram OB. line graph O C. pie chart OD. scatter plot OL. All of the above OW. None of the above
3. Which of the following is the most appropriate graph to compare the distribution of calorie intake of women who weigh more than 50 kg and of those who weigh below 50kg? OA. histogram OB. line graph O C. pie chart OD. scatter plot OL. All of the above OW. None of the above

Chapter6: Exponential And Logarithmic Functions
Section6.8: Fitting Exponential Models To Data
Problem 51SE: For the following exercises, refer to Table 12. Use a graphing calculator to create a scatter...

Related questions
Question
3.
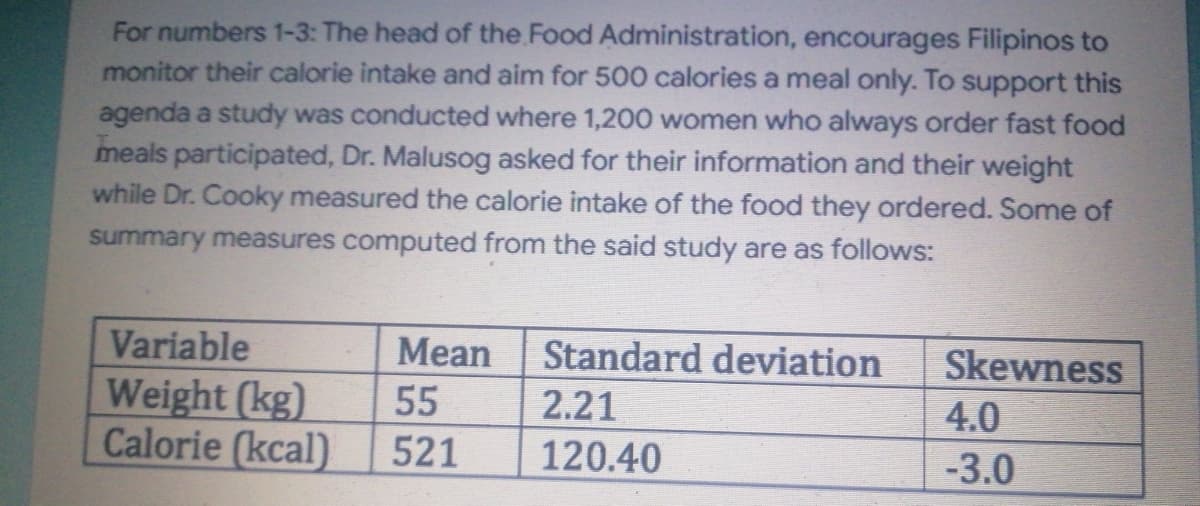
Transcribed Image Text:For numbers 1-3: The head of the Food Administration, encourages Filipinos to
monitor their calorie intake and aim for 500 calories a meal only. To support this
agenda a study was conducted where 1,200 women who always order fast food
meals participated, Dr. Malusog asked for their information and their weight
while Dr. Cooky measured the calorie intake of the food they ordered. Some of
summary measures computed from the said study are as follows:
Variable
Mean
Standard deviation
Skewness
Weight (kg)
55
2.21
4.0
Calorie (kcal)
521
120.40
-3.0
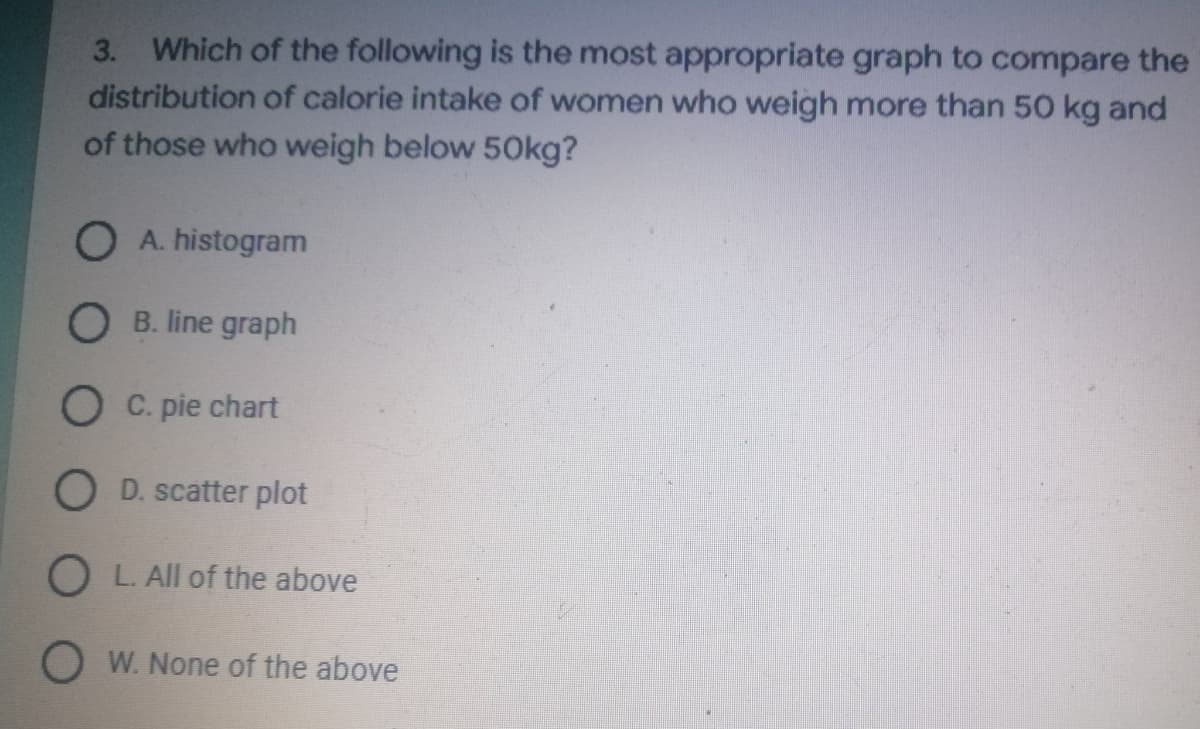
Transcribed Image Text:3. Which of the following is the most appropriate graph to compare the
distribution of calorie intake of women who weigh more than 50 kg and
of those who weigh below 50kg?
OA. histogram
OB. line graph
OC. pie chart
OD. scatter plot
OL. All of the above
OW. None of the above
Expert Solution
This question has been solved!
Explore an expertly crafted, step-by-step solution for a thorough understanding of key concepts.

Step by step
Solved in 2 steps

Recommended textbooks for you

Algebra for College Students
Algebra
ISBN:
9781285195780
Author:
Jerome E. Kaufmann, Karen L. Schwitters
Publisher:
Cengage Learning

Functions and Change: A Modeling Approach to Coll…
Algebra
ISBN:
9781337111348
Author:
Bruce Crauder, Benny Evans, Alan Noell
Publisher:
Cengage Learning
Algebra for College Students
Algebra
ISBN:
9781285195780
Author:
Jerome E. Kaufmann, Karen L. Schwitters
Publisher:
Cengage Learning
Functions and Change: A Modeling Approach to Coll…
Algebra
ISBN:
9781337111348
Author:
Bruce Crauder, Benny Evans, Alan Noell
Publisher:
Cengage Learning