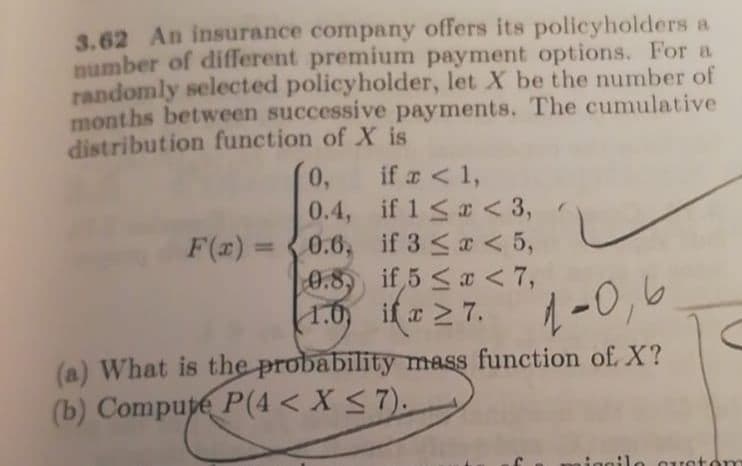
3.62 An insurance company offers its policyholders a number of different premium payment options. For a randomly selected policyholder, let X be the number of months between successive payments. The cumulative distribution function of X is


Q: 2. The number of car accidents in a certain street per week follow a poisson distribution with a…
A: Gien,mean(λ)=0.5A random variable X~Poisson(λ=0.5)P(X=x)=e-0.5 0.5xx! ; x≥0
Q: (b) The number of customers who patronise a coffee shop follows a Poisson distribution with a mean…
A:
Q: The number of large packages delivered by a courier service follows a Poisson distribution with a…
A: Given: The number of large packages delivered follows a Poisson distribution with a rate of 5 per…
Q: All airplane passengers at the Lake City Regional Airport must pass through a security screening…
A: (a). Compute the operating characteristics for the screening facility: On Monday morning, the…
Q: A bank manager estimates that an average of one customers enter the tellers" queue every ten…
A: GivenAn average of 1 customers enter the tellers's queue for every 10 minutesfor 30 min =1*3=3λ=3…
Q: Suppose that a day's production of 750 manufactured parts contains 60 parts that do not conform to…
A: We have to find out the CDF of the given distribution.
Q: Suppose that a day's production of 850 manufactured parts contains 100 parts that do not conform to…
A: Frequency is the count of variable which occurred or repeated number of times. It can be divide into…
Q: With reference to Example 4, verify that the values ofthe distribution function are given by F(x) =…
A:
Q: The amount of a loss X follows the uniform distribution on [0, 100]. An insurance pol on this loss…
A: From the given information, the amount of a loss X follows the uniform distribution on [0, 100].…
Q: Let us suppose that a particular lecturer manages, with probability 1, to develop exams that have…
A:
Q: 3) Assume that the weight loss for the first month of a diet program varies between 5 pounds and 12…
A:
Q: Find the distribution functions and con- ditional cdf's.
A:
Q: Suppose that the cumulative distribution function of Y is as follows 10 8 7 6 5 4 3 2 1 10.998…
A:
Q: 4. A mail-order computer business has six telephone lines. Let X denote the number of lines in use…
A:
Q: Consider that the number of flaws occuring in each 100 feet of material follows the Poisson…
A: It is given that there is an average of 2 flaws in 100 feet material. So, the average number of…
Q: A group policy, with 15 employees, offers a basic and a supplemental plan. i. The basic plan has an…
A:
Q: a newspaper seller orders 10,000 unites of newspaper for his inventory.suppose demand for th…
A: Consider that the mean and standard deviation of a random variable X are µ and σ, respectively.…
Q: The number of suits sold per week by a store follows a Poisson distribution with mean 14. Then the…
A:
Q: Assume that the random variable X follows a uniform distribution over [1,6]. What is the value of…
A:
Q: Suppose that a day's production of 800 manufactured parts contains 50 parts that do not conform to…
A:
Q: Construct a binomial distribution graph for the number of defective computer chips in a lot of 3 if…
A: Consider X be a random variable which follows binomial distribution indicates the number of…
Q: ) The number of customers, X, arriving in a ATM in the afternoon can be modeledusing a Poisson…
A: Let the number of customers, X, arriving in a ATM in the afternoon can be modeledusing a Poisson…
Q: A bakery is staffed by two clerks, each of them capable of handling an average of 30 customers an…
A: Given: A bakery is staffed by two clerks, each of them capable of handling an average of 30…
Q: Draw the graph of cumulative distribution function of R and prob mass function of R R = average…
A: From the given information, P=result of rolling 4 sided dice. That is, the variable P takes the…
Q: 2) An insurance policy on a ground-up loss process X has a uniform distribution between 0 and 3000,…
A: Given that an insurance policy on a ground-up loss process X has a uniform distribution between 0…
Q: Let X is a discrete random variable whose cumulative distribution function graph is given below: 11…
A:
Q: Find the cumulative distribution function of the total number of heads obtained in three tosses of a…
A: Solution : Let, coin is tossed 3 times , sample space is, Ω = { HHH, HHT, HTH, THH, THT, HTT, TTH,…
Q: The number of earthquakes in a certain region of California during a 6 month period has a Poisson…
A:
Q: 8 . Assuming that the typing mistakes per page committed by typist follows a poisson distribution.…
A:
Q: Previous records have indicated that the number of rejected eggs per crate follows the Poisson…
A: Given that the mean of the Poisson distribution is 1.5, where the data is 4,0,2,0,2,0,2,0 Also given…
Q: 1 The average life of a certain type of electric bulb is 1200 hours. What percentage of this type of…
A: Normal distribution is a continuous distribution which has many real life applications. Normal curve…
Q: A recent national study showed that approximately 55.8% of college students have used Google as a…
A: Since you have posted a question with multiple sub-parts, we will solve first three subparts for…
Q: The number of suits sold per week by a store follows a Poisson distribution with mean 14. Then the…
A: Given data,lamda=14P(X=2)=?
Q: 5. Descriptive statistics for the closing stock prices of two companies for several trading periods…
A: Given that: Microsoft, Inc Mean 4.04 Kurtosis -1.1 Standard error 0.11 Skewness 0.04 Median…
Q: 6- It is given that 25% of the total inventory items in a company's warehouse explains 85% of the…
A: Assume, X be the proportion of total inventory items that explains Y proportion of the value of the…
Q: A car hire firm has two cars, which it hires out day by day. The number. of demands for a car on…
A:
Q: Let X be the time between successive arrivals to an intersection in a rural area. Suppose cars…
A: It is given that the intersection via a Poisson process at a rate of 1 every 5 minutes.
Q: What is the P(-1 SYS 2)? Find the cumulative distribution function of
A:
Q: Determine the probabilityof x is any value from 3/2 to 2? The cumulative distribution function for…
A: It is an important part of statistics. It is widely used.
Q: The number of flaws in bolts of cloth in textile manufacturing is assumed to be Poisson distributed…
A:
Q: What is the age distribution of promotion-sensitive shoppers? A supermarket super shopper is defined…
A: Given the data as Age range, years Midpoint x Percent of super shoppers 18-28 23 6% 29-39 34…
Q: Consider that the number of flaws occuring in each 100 feet of material follows the Poisson…
A: GivenAverage no.of flaws occurring in each 100 feet of material is 2average no. of flaws in each 250…
Q: 2) An insurance policy on a ground-up loss process X has a uniform distribution between 0 and 3000,…
A: Given that an insurance policy on a ground-up loss process X has a uniform distribution between 0…
Q: 2. a. If the shaded area on the left-hand tail of t- distribution with sample of size n = 28 is…
A: The critical region indicate the region where the test statistic appear they can able to reject the…
Q: The orders from n = 100 customers for wooden panels of various thickness (X) are summarized as…
A: a) Probability distribution: X No of customer ders(f) Probability 1/8 20 20/100=0.2 1/4 70…
Q: An investment firm establiesd in 1987 in Turkey offers its customers municipal bonds that mature…
A:
Q: Parcels arrive either 1 day after ordering with probability 2 days after ordering with 4' 1 or 3…
A: Given information: Given that the parcels arrive either 1 day after ordering with probability ¼, 2…
Q: Suppose the number X of tornadoes observed in a particular region during a 1-year period has a…
A: From the given information, The number of X of tornadoes observed in a particular region during 1…


Trending now
This is a popular solution!

Step by step
Solved in 3 steps with 4 images

- An insurance company offers its policyholders a number of different premium payment options. For a randomly selected policyholder, let X = the number of months between successive payments.An insurance company offers its policyholders a number of different premium payment options. For a randomly selected policyholder, let X = the number of months between successive paymentConsider the number of days to maturity of 10 short-term investments below: 85 77 88 78 65 78 57 81 36 90 (i) Make a stem-and-leaf plot for the days-to-maturity data. (2) (ii) Hence, or otherwise, compute the interquartile range of the data. (3) (iii) Are there any outliers in the data.
- Suppose that a consumer cannot vary hours of work as he or she chooses. In particular, he or she must choose between working q hours and not working at all, where q > 0. Suppose that dividend income is zero, and that the consumer pays a tax T if he or she works, and receives a benefit b when not working, interpreted as an unemployment insurance payment. a. If the wage rate increases, how does this affect the consumer’s hours of work? What does this have to say about what we would observe about the behavior of actual consumers when wages change? Explained also with the graph b. Suppose that the unemployment insurance benefit increases. How will this affect hours of work? Explain the implications of this for unemployment insurance programs. Explained also with the graphAcoording to scientists, the cockroach has had 300 million years to develop a resistance to destruction. In a study conducted by tesearchers, 4,000 reaches (the expected number in a rouch-infested house) were released in the tost kibchen. One week later, the kitchen was fumigated and 14,465 dead roaches were counted, a gain of 10,465 roaches for the 1 -week period. Assume that none of the original roaches died during the 1 -week period and that the standard deviation ofx, the number of roaches produced per roach in a 1 -weok period, is 1.3 . Use the number of roaches produced by the sample of 4,000 rosches to find a pos confidence interval for the mean number of roaches produced per wook for each rosch in a typical toach-infosted house. Find a99%confidence interval for the mean number of roaches prodused per week for each roach in a typical roach infested housen (Round to three decimal places as needed)Find out the next month after april income by using the forecasting method of the moving average method
- William Profit is studying companies going public for the first time. He isparticularly interested in the relationship between the size of the offering and theprice per share. A sample of 15 companies that recently went public revealed the following information: y x 10.8 9 11.3 94.4 11.2 27.3 11.1 179.2 11.1 71.9 11.2 97.9 11 93.5 10.7 70 11.3 160.7 10.6 96.5 10.5 83 10.3 23.5 10.7 58.7 11 93.8 10.8 34.4Mine Police Post recorded over a one year period the number of drug abuse offences among the youth in that compound indicating their frequence of occurence as provided for in the data given below.Number of drug abuse cases: 0-10 10-20 20-30 30-40 40-50 50-60 60-70 70-80 80–90 90 -100Frequency of occurence: 3 5 6 7 8 9 10 12 6 4Requireda) Construct a less than and more than cumulative frequency table and plot the resultant ogives.b) Comment on the answer in a) aboveN owns a Disability Income policy that will cover him to age 65, allhough the insurance company has the right to change the premium rate for the overall risk class to which N is assigned Which of he following types of renewability best describes this situation? A. Noncancellable B. Cancellable C. Guaranteed Renewable D. Optionally Renewable
- item 2020 unit price (P0) 2020quantity (q0) 2021 UNIT PRICE (P1) 2021 quantiy (q1) mineral spirits R23,70 30 R27.70 45 100mm spanner R49.00 60 R65.00 50 25mm brush R58.00 30 R63.00 40 Using 2020 as the base year, compute the price relatives in 2021 for the 10mm spanner and the 25mm brush AND compute the Paasche price index for all of the items for 2021.Respond to each of the items using the following time series data. Period Demand 1 104 2 132 3 117 4 120 5 104 6 141 7 120 8 136 9 109 10 143 11 142 12 109 13 113 14 124 15 113 16 107The savings (in percentage of salary) of 50 randomly selected persons are given as follows: City A 9 5 11 8 5 6 2 13 11 10 3 4 4 6 11 5 6 17 9 10 16 3 16 13 7 10 2 7 1 3 12 14 8 3 8 7 2 10 17 12 9 13 5 4 3 28 11 2 3 5 City B 18 13 21 16 12 14 7 23 20 19 9 10 10 14 21 12 14 29 19 20 27 9 27 23 14 19 7 15 5 9 22 25 16 8 17 15 7 19 28 23 17 23 13 10 9 42 21 6 8 12 Analyse the data to study the pattern of savings of salaried persons in two cities. Use appropriate graphs and measures to draw conclusions. Also draw box-whisker plot to compare the two distribution