35 For the grouped data of Table 2.29, find (a) the first quartile, (b) the second quartile. quartile, (d) the fourth decile, and (e) the seventieth percentile. Ans. (a) Q₁ = $1.11 (b) Q₂ $1.16 (c) Q3 $1.21 (d) D4 = $1.146 (e) P70 $1.
35 For the grouped data of Table 2.29, find (a) the first quartile, (b) the second quartile. quartile, (d) the fourth decile, and (e) the seventieth percentile. Ans. (a) Q₁ = $1.11 (b) Q₂ $1.16 (c) Q3 $1.21 (d) D4 = $1.146 (e) P70 $1.

Glencoe Algebra 1, Student Edition, 9780079039897, 0079039898, 2018
18th Edition
ISBN:9780079039897
Author:Carter
Publisher:Carter
Chapter10: Statistics
Section10.4: Distributions Of Data
Problem 19PFA

Related questions
Question
Answer letter C and E only. Show complete solution. Thank you!
Transcribed Image Text:2.35
PH
For the grouped data of Table 2.29, find (a) the first quartile, (b) the second quartile.
quartile, (d) the fourth decile, and (e) the seventieth percentile.
Ans. (a) Q₁ = $1.11 (b) Q₂ $1.16 (c) Q3 $1.21 (d) D4 = $1.146 (e) P70 $1.
2:36 For the grouped data in Table 2.30 find. (a) the first quartile (h) the third quartile
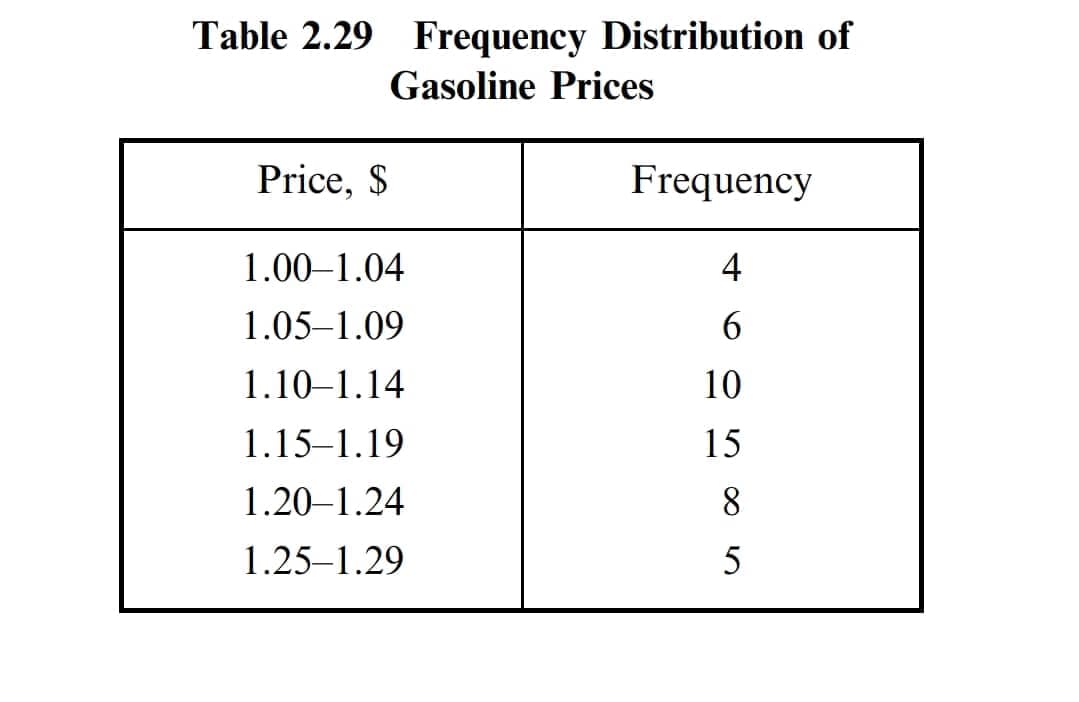
Transcribed Image Text:Table 2.29 Frequency Distribution of
Gasoline Prices
Price, $
1.00-1.04
1.05-1.09
1.10-1.14
1.15-1.19
1.20-1.24
1.25-1.29
Frequency
4
6
10
15
8
5
Expert Solution
This question has been solved!
Explore an expertly crafted, step-by-step solution for a thorough understanding of key concepts.

Step by step
Solved in 2 steps with 1 images

Recommended textbooks for you
Glencoe Algebra 1, Student Edition, 9780079039897…
Algebra
ISBN:
9780079039897
Author:
Carter
Publisher:
McGraw Hill
Glencoe Algebra 1, Student Edition, 9780079039897…
Algebra
ISBN:
9780079039897
Author:
Carter
Publisher:
McGraw Hill