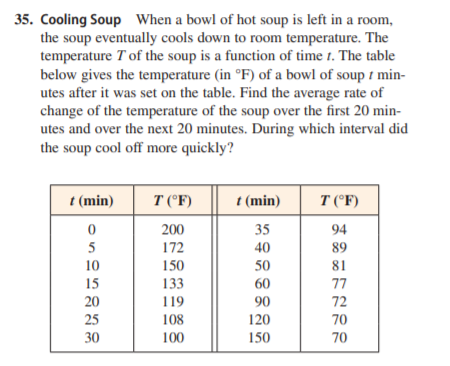
35. Cooling Soup When a bowl of hot soup is left in a room, the soup eventually cools down to room temperature. The temperature T of the soup is a function of time 1. The table below gives the temperature (in °F) of a bowl of soup t min- utes after it was set on the table. Find the average rate of change of the temperature of the soup over the first 20 min- utes and over the next 20 minutes. During which interval did the soup cool off more quickly? t (min) T (°F) t (min) T (°F) 200 35 94 5 172 40 89 10 150 50 81 15 133 60 77 20 119 90 72 25 108 120 70 30 100 150 70


Contingency Table
A contingency table can be defined as the visual representation of the relationship between two or more categorical variables that can be evaluated and registered. It is a categorical version of the scatterplot, which is used to investigate the linear relationship between two variables. A contingency table is indeed a type of frequency distribution table that displays two variables at the same time.
Binomial Distribution
Binomial is an algebraic expression of the sum or the difference of two terms. Before knowing about binomial distribution, we must know about the binomial theorem.
Book Collection Between 1980 and 2000 a rare book collector purchased books for his collection at the rate of 40 books
per year. Use this information to complete the following
table. (Note that not every year is given in the table.)


Trending now
This is a popular solution!

Step by step
Solved in 4 steps


