
Elementary Geometry For College Students, 7e
7th Edition
ISBN:9781337614085
Author:Alexander, Daniel C.; Koeberlein, Geralyn M.
Publisher:Alexander, Daniel C.; Koeberlein, Geralyn M.
Chapter5: Similar Triangles
Section5.4: The Pythagorean Theorem
Problem 2E: Use theorem 5.4.2 to form a proportion in which SV is a geometric mean. Hint: SVTRVS Exercises 1-6

Related questions
Question
Transcribed Image Text:11:31
Done
app.edulastic.com AA C
E·
Question 9/10
> NEXT
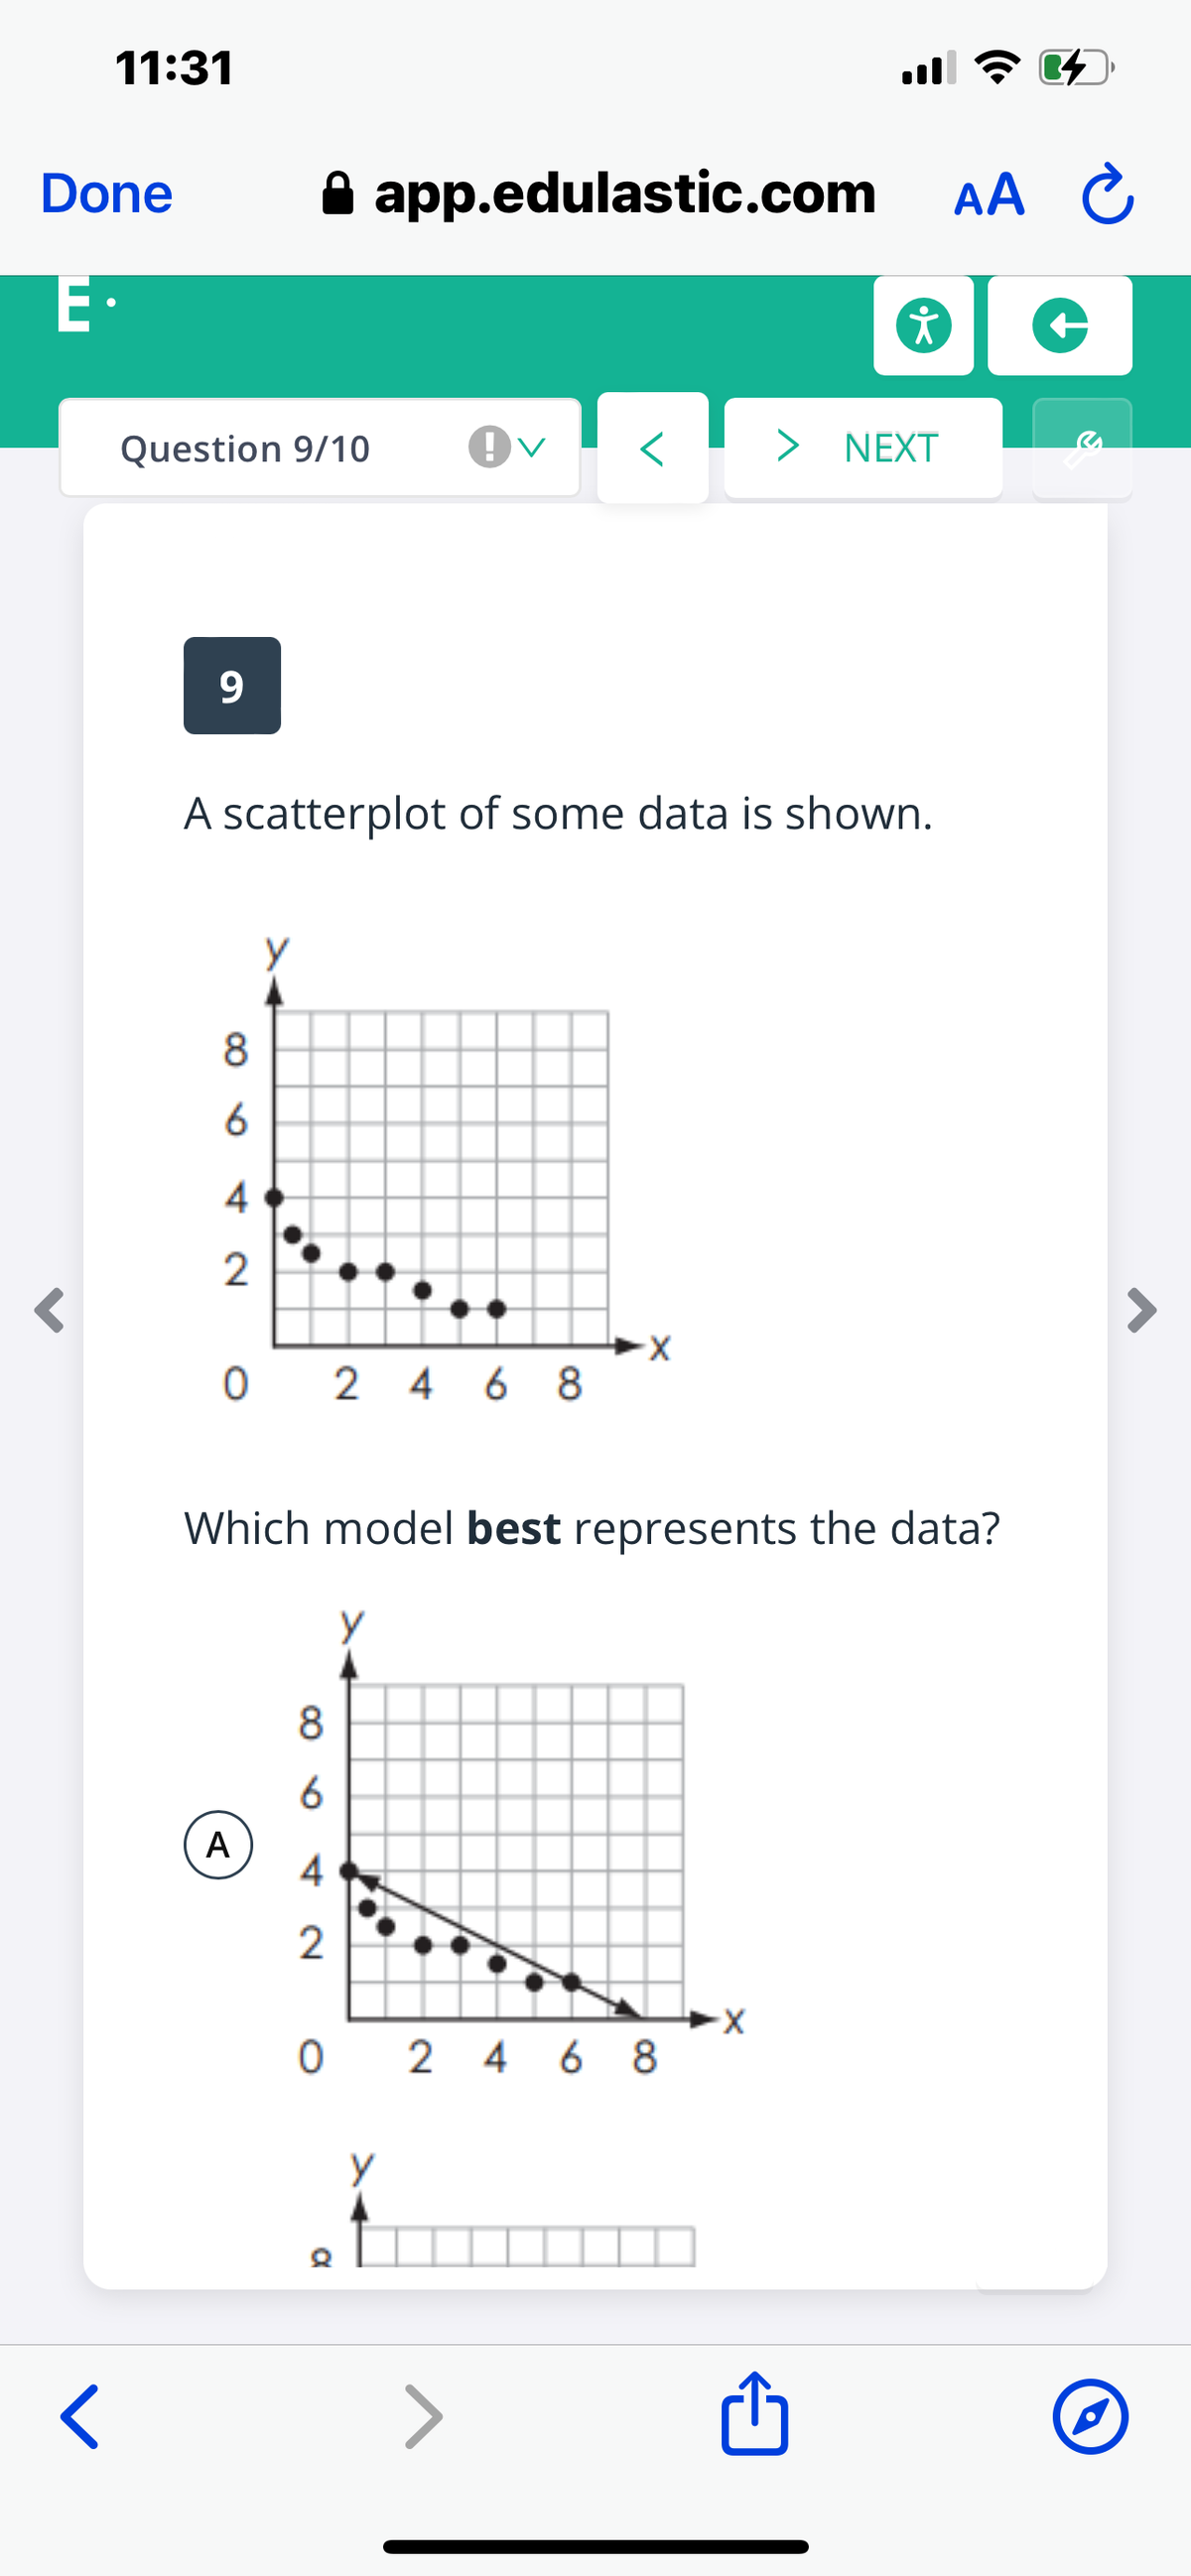
9.
A scatterplot of some data is shown.
8.
4
2
0 2 4 6 8
Which model best represents the data?
8
6
A
O 2 4 6 8
Transcribed Image Text:11:31
Done
app.edulastic.com AA C
E·
Question 9/10
> NEXT
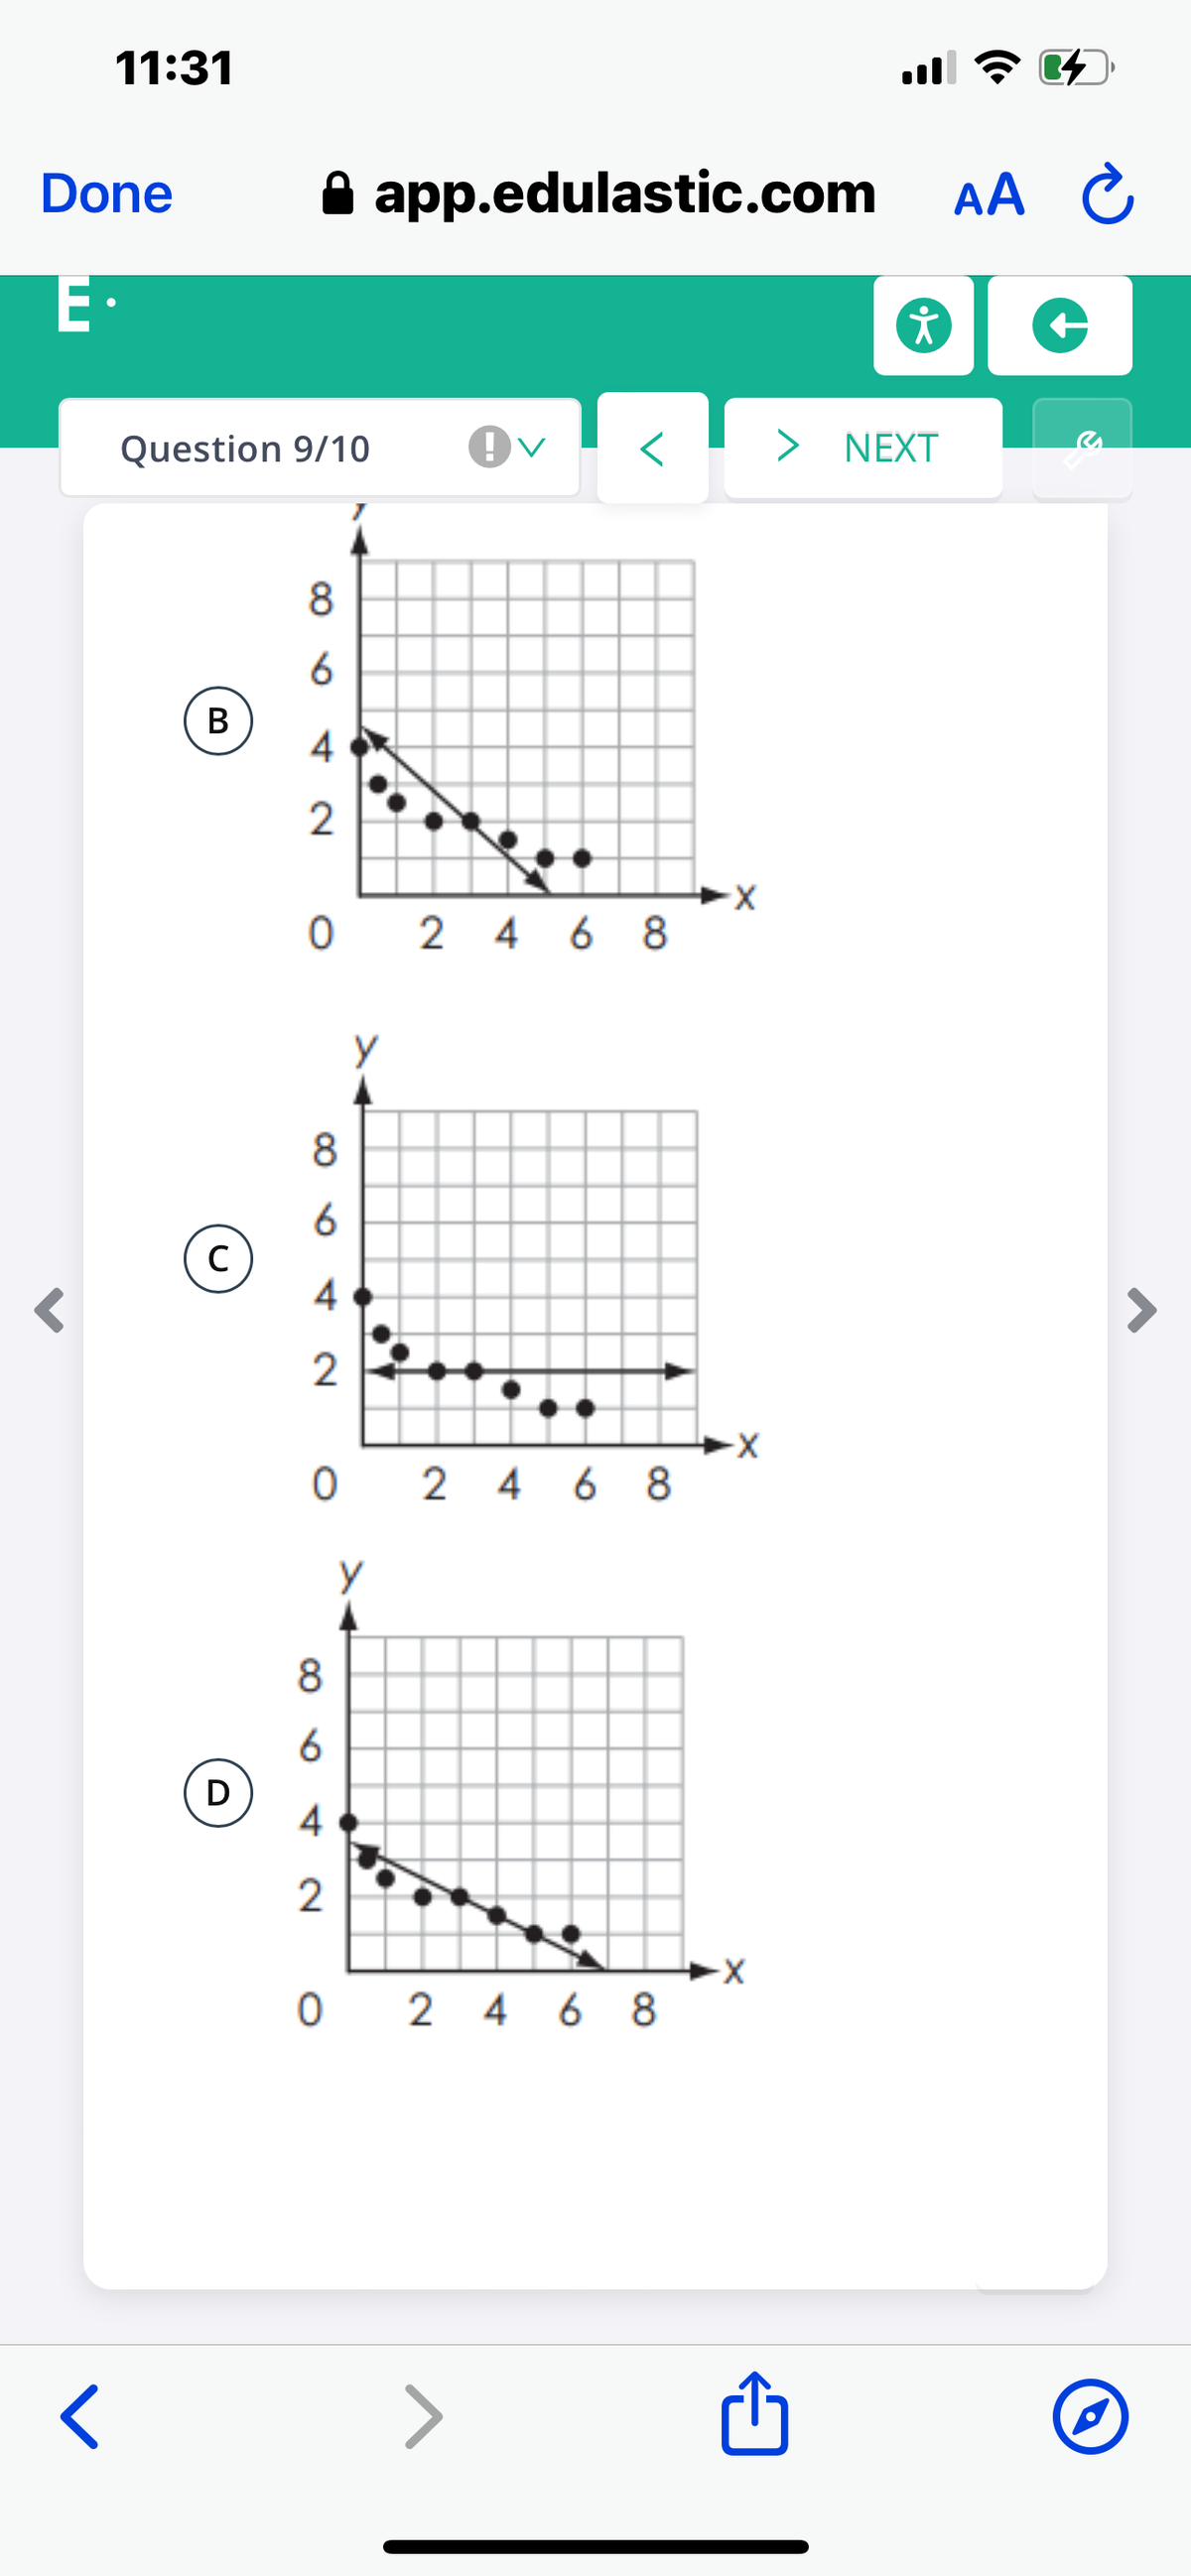
8.
B
4
O 2 4 6 8
6
4
2
O 2 4 6 8
y
8.
6
D
4
O 2 4 6 8
Expert Solution
This question has been solved!
Explore an expertly crafted, step-by-step solution for a thorough understanding of key concepts.

Step by step
Solved in 2 steps with 1 images

Recommended textbooks for you
Elementary Geometry For College Students, 7e
Geometry
ISBN:
9781337614085
Author:
Alexander, Daniel C.; Koeberlein, Geralyn M.
Publisher:
Cengage,

Glencoe Algebra 1, Student Edition, 9780079039897…
Algebra
ISBN:
9780079039897
Author:
Carter
Publisher:
McGraw Hill

Big Ideas Math A Bridge To Success Algebra 1: Stu…
Algebra
ISBN:
9781680331141
Author:
HOUGHTON MIFFLIN HARCOURT
Publisher:
Houghton Mifflin Harcourt
Elementary Geometry For College Students, 7e
Geometry
ISBN:
9781337614085
Author:
Alexander, Daniel C.; Koeberlein, Geralyn M.
Publisher:
Cengage,
Glencoe Algebra 1, Student Edition, 9780079039897…
Algebra
ISBN:
9780079039897
Author:
Carter
Publisher:
McGraw Hill
Big Ideas Math A Bridge To Success Algebra 1: Stu…
Algebra
ISBN:
9781680331141
Author:
HOUGHTON MIFFLIN HARCOURT
Publisher:
Houghton Mifflin Harcourt