2 3 5 6 7 6 4 2 1 catter diagram for the data. 10 Gra Clear All 1.

MATLAB: An Introduction with Applications
6th Edition
ISBN:9781119256830
Author:Amos Gilat
Publisher:Amos Gilat
Chapter1: Starting With Matlab
Section: Chapter Questions
Problem 1P

Related questions

Concept explainers
Contingency Table
A contingency table can be defined as the visual representation of the relationship between two or more categorical variables that can be evaluated and registered. It is a categorical version of the scatterplot, which is used to investigate the linear relationship between two variables. A contingency table is indeed a type of frequency distribution table that displays two variables at the same time.
Binomial Distribution
Binomial is an algebraic expression of the sum or the difference of two terms. Before knowing about binomial distribution, we must know about the binomial theorem.
Topic Video
Question
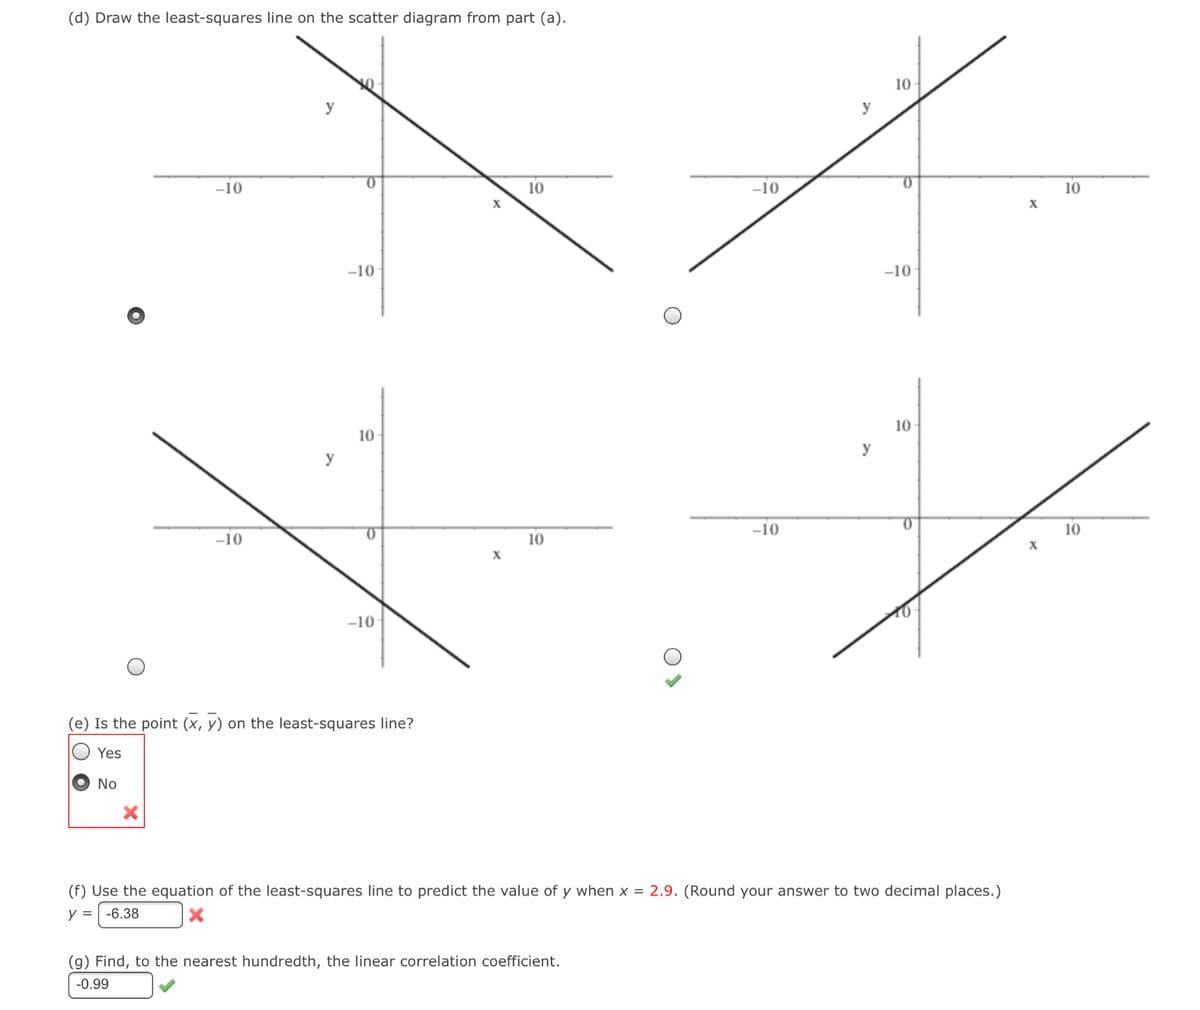
Transcribed Image Text:(d) Draw the least-squares line on the scatter diagram from part (a).
10
y
-10
10
-10
10
-10
-10
10
10
y
y
-10
10
-10
10
-10
(e) Is the point (x, y) on the least-squares line?
Yes
No
(f) Use the equation of the least-squares line to predict the value of y when x = 2.9. (Round your answer to two decimal places.)
y =
-6.38
(g) Find, to the nearest hundredth, the linear correlation coefficient.
-0.99
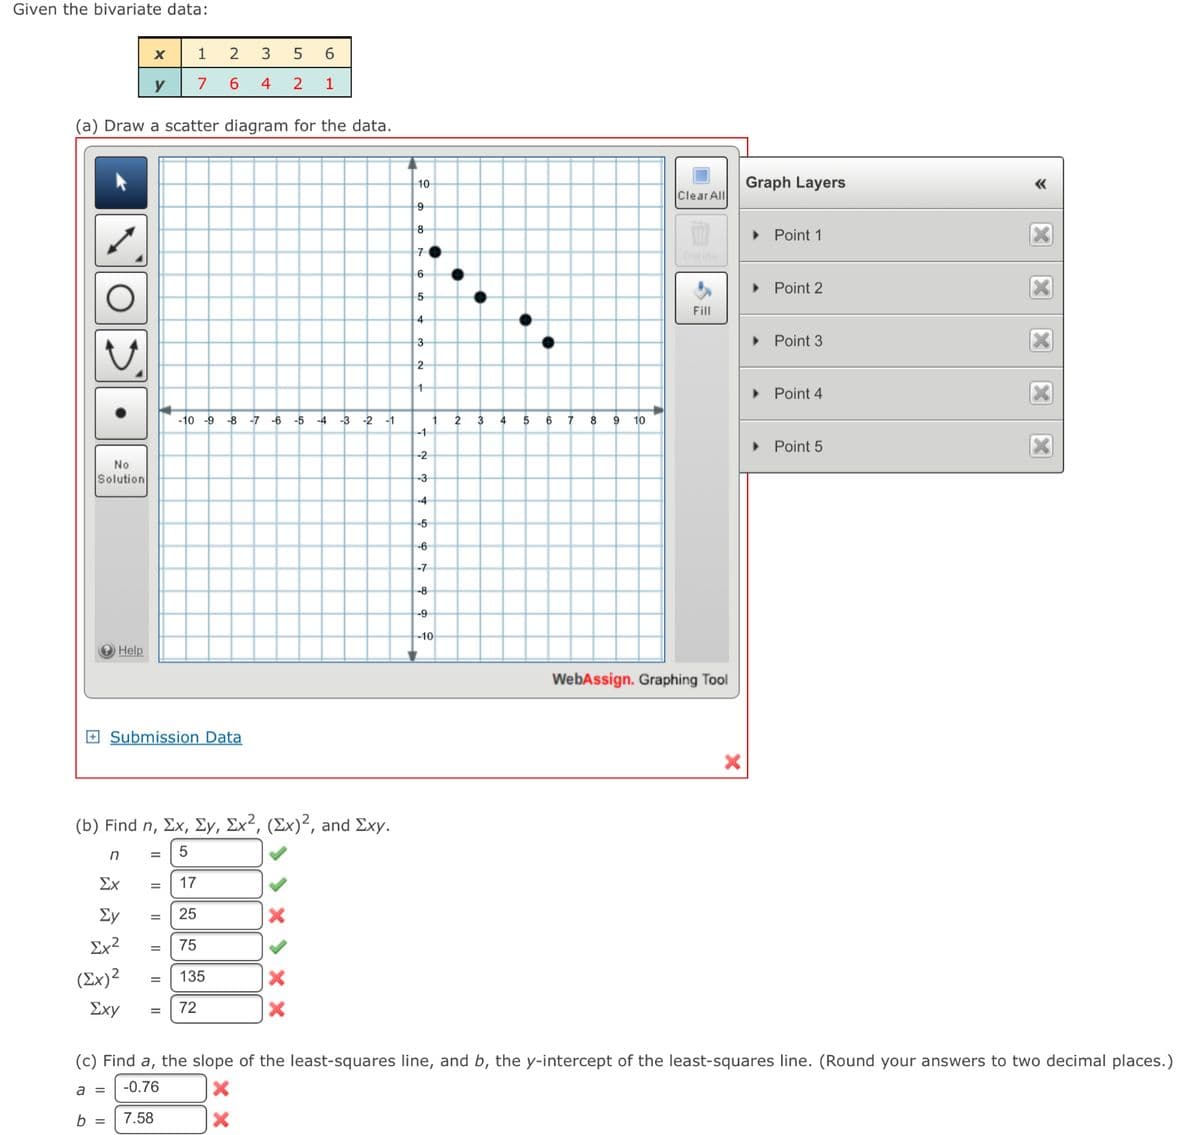
Transcribed Image Text:Given the bivariate data:
1
3
5
y
7
6.
4
2
1
(a) Draw a scatter diagram for the data.
10
Graph Layers
Clear All
8
Point 1
6
Point 2
Fill
4
3
• Point 3
2
1
Point 4
-10 -9 -8
-7 -6
-5 -4 -3 -2 -1
2
3
4
5
6
8
10
-1
Point 5
-2
No
Solution
-3
4
5
6
-7
-8
--9
-10
O Help
WebAssign. Graphing Tool
+ Submission Data
(b) Find n, Σχ, ΣΥ, Σχ2, (Σx),, and Σχy.
in
Σχ
17
Ey
25
Ex?
75
(Ex)?
13
Exy
72
(c) Find a, the slope of the least-squares line, and b, the y-intercept of the least-squares line. (Round your answers to two decimal places.)
a =
-0.76
b =
7.58
II
Expert Solution
This question has been solved!
Explore an expertly crafted, step-by-step solution for a thorough understanding of key concepts.

Step by step
Solved in 8 steps with 1 images

Knowledge Booster


Learn more about
Need a deep-dive on the concept behind this application? Look no further. Learn more about this topic, statistics and related others by exploring similar questions and additional content below.Recommended textbooks for you
MATLAB: An Introduction with Applications
Statistics
ISBN:
9781119256830
Author:
Amos Gilat
Publisher:
John Wiley & Sons Inc

Probability and Statistics for Engineering and th…
Statistics
ISBN:
9781305251809
Author:
Jay L. Devore
Publisher:
Cengage Learning

Statistics for The Behavioral Sciences (MindTap C…
Statistics
ISBN:
9781305504912
Author:
Frederick J Gravetter, Larry B. Wallnau
Publisher:
Cengage Learning
MATLAB: An Introduction with Applications
Statistics
ISBN:
9781119256830
Author:
Amos Gilat
Publisher:
John Wiley & Sons Inc
Probability and Statistics for Engineering and th…
Statistics
ISBN:
9781305251809
Author:
Jay L. Devore
Publisher:
Cengage Learning
Statistics for The Behavioral Sciences (MindTap C…
Statistics
ISBN:
9781305504912
Author:
Frederick J Gravetter, Larry B. Wallnau
Publisher:
Cengage Learning

Elementary Statistics: Picturing the World (7th E…
Statistics
ISBN:
9780134683416
Author:
Ron Larson, Betsy Farber
Publisher:
PEARSON

The Basic Practice of Statistics
Statistics
ISBN:
9781319042578
Author:
David S. Moore, William I. Notz, Michael A. Fligner
Publisher:
W. H. Freeman

Introduction to the Practice of Statistics
Statistics
ISBN:
9781319013387
Author:
David S. Moore, George P. McCabe, Bruce A. Craig
Publisher:
W. H. Freeman