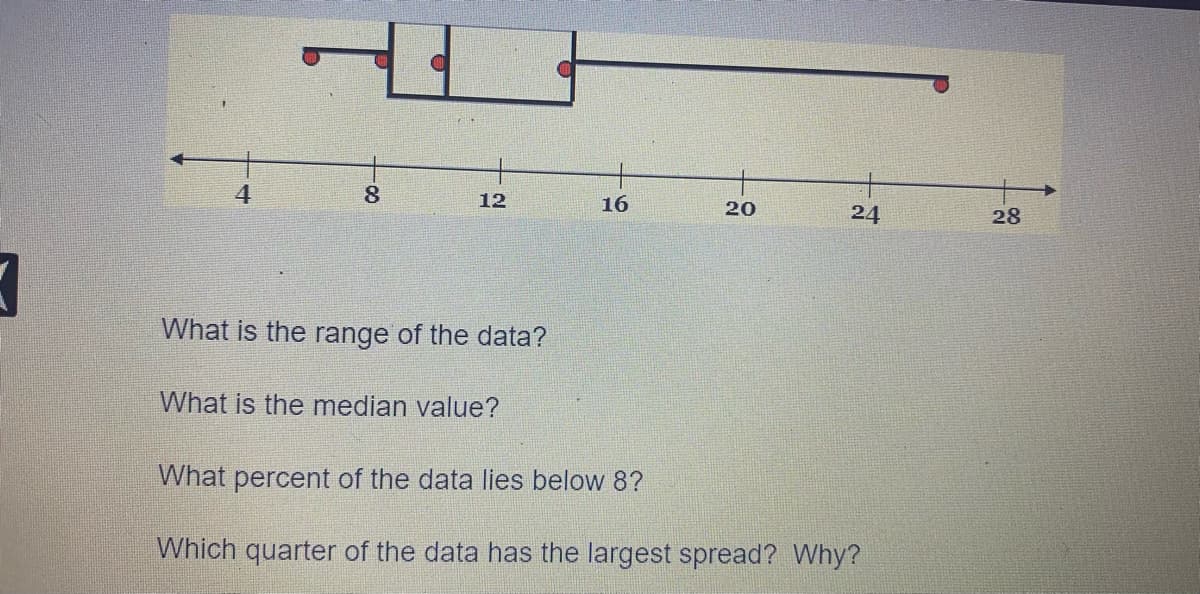
4 8. 12 16 20 24 28 What is the range of the data? What is the median value? What percent of the data lies below 8? Which quarter of the data has the largest spread? Why?
Q: 12. a. What percent of the customers in the cartoon are exactly the median age? b. Must one item…
A: The percentage of customers in the cartoon exactly the median age is zero percentage 0%because half…
Q: 8) Following are box-and-whisker plots comparing the study times in hours per week for Sarah and…
A: Given that: A box and whisker plot is given for Sarah and Elaine. Firstly find five number summary…
Q: d. What percentage of the variance in the data does the R-squared value explain?
A: The R squared value is known as coefficient of determination and it is defined as the square of the…
Q: What is the variance of the small DATA: 7, 13, 5, 9, 16 a. 4.47
A: The data is given as follows 7 13 5 9 16
Q: \text { 3.4.9. Determine the 90th percentile of the distribution, which is } N(65,25) \text { . }
A: Percentiles are the values which divide the whole area under the graph into 100 equal parts. (90%)…
Q: 3. What could be the approximate value of the corelation coefficient for the accompanying scatter…
A: 3. It is clear that the data points are closer to each other and also observed that as the values of…
Q: - Find the mean, median, and mode for the following data. Round noninteger values to the nearest…
A:
Q: 9. Does this scatter plot show a positive association, negative association, or no association?…
A: As per bartleby guideline for more than one question asked only first is to be answered please…
Q: 1. How many jobs are being considered in the histogram? 2. How many jobs grant over $35,000? 3. What…
A: note :s As per our company guidelines we are supposed to answer ?️only first 3 sub-parts. Kindly…
Q: The following data give the margin of victory for a football championship over 15 years. 13 8 3 11…
A: The given data is 13, 8, 3, 11, 12, 3, 4, 27, 8, 4, 3, 35, 6, 14, 3.
Q: 10 11 12 13 15 15 16 17 18 18 What is the mean median and mode of this data in descriptive stat
A: Consider, X = 10, 11, 12, 13, 15, 15, 16, 17, 18, 18 The mean for the provided data set can be…
Q: Review Chapters 9 & 10 5) Test for a linear correlation between price and bedrooms in South Salinas.
A: Correlation: The statistical relationship between two variables is known as correlation.…
Q: For a moderately skewed distribution of supply of Product A, arithmetic mean is 100, and coefficient…
A:
Q: 9 11 12 20 20 23 23 24 33 33 35 35 35 35 38 39 USE SALT a) What is the mean? (Round your answer to…
A:
Q: The following refer to the following data set: 19.8 21.7 28.8 32.5 39.4 39.8 45.3 57.3 57.3 57.3…
A:
Q: 2. At the .05 level of significance, is there evidence of a difference in average sales between the…
A: The retailing manager of food chain wishes to determine whether product location has any effect on…
Q: 4. A number or a summarized measure that describes the characteristic of a population is called…
A:
Q: 5) What effect would adding a constant to each data value in a set have on the mean and variance of…
A: What effect adding a constant to each data value in a set have on the mean and variance of the set.
Q: 2000 5 2001 2002 2003 4. 2004 2005 2006 2007 3 4. Find the mean, median, mode, standard deviation…
A:
Q: 4. Given: Age 16-18 frequency 20 18 19-21 22-24 8 25-27 4 Find: mean, median, mode, Q1, D6, P12
A: Hi there! Thanks for posting the question. Since there are multiple questions, we will solve one…
Q: 12. Find the mean, range, variance, and standard deviation for the hours studied for: a. Part-time…
A: Given, A survey of 20 social science students enrolled in an evening statistics course was…
Q: Consider the boxplot below. 23 36 46 61 79 20 30 40 50 60 70 80 data a. What quarter has the…
A: Given that
Q: 8. 6 1 16 21 data 26 31 Based on the histogram above, what is the frequency of the class containing…
A:
Q: Find the mean, median, and mode of the data, if possible. If any of these measures cannot be found…
A: We have given that, The data set are : 28 38 18 28 58 18 61 77 54 121 Then, We will find the…
Q: a. Which age group typically has the highest rate of obesity? b. Comment on any similarities and…
A: The bar plot has been provided to find out conclusion
Q: 3. In your own words, explain why the parameter is fixed and the statistic varies. 4. Select 90…
A: 3)The parameter is a characteristic of population and it summarises entire population. For example:…
Q: 8) Following are box-and-whisker plots comparing the study times in hours per week for Sarah and…
A: A box and whisker plot is given : Firstly find the five number summary from box and whisker plot. We…
Q: 10 12 14 16 18 20 22 24 26 28 30 32 34 Length (cm) A lizard that is one standard deviation below the…
A: Given Information:
Q: 11. What is the mean of this data? A. 0 B. 1 C. 2 D. 3 12. What is its median? (Same choices as in…
A: Given that : A data set { 0,0,1,4,5 } We use here mode concept to solve this.
Q: 19. Describe the shape of the data distribution and the location of the mean in relation to the…
A: Shape of the box plot is positive skewed In positive skewed Mean > median > mode
Q: C. Determine which measure of variability is appropriate to use in making the following reports. 8.…
A: 8) Standard deviation is the best measure of variability in making the report of variation in daily…
Q: 5. Use the following table to answer the questions asked. Rel. Freq. Cum Rel.Freg Score Frequency 89…
A: We have give the following table Note: According to Bartleby expert guidelines, we can answer only…
Q: The number of days travelers purchase their airline tickets ahead of their flights can be modeled by…
A:
Q: 8) Following are box-and-whisker plots comparing the study times in hours per week for Sarah and…
A: Let Q1= first quartile, Q2=second quartile=median, Q3=third quartile Farmula used Range=max-min…
Q: 1. How many jobs are being considered in the histogram? 2. How many jobs grant over $35,000? 3. What…
A: 4. Bimodal is the shape of the histogram 5. median is the best measure
Q: Answer the questions about the data represented by the box-and-whisker plot. 10 15 20 25 30 35 40 45…
A: A box and whisker plot is an appropriate diagram to represent the spread of the data over a range of…
Q: these puzzle solving times. Should the minimum and maximum data values be denoted as outliers in the…
A: The summary of data is given by Minimum = 21.5 Q1 = 39 Median = 45 Q3 = 51.5 Maximum = 71, Then…
Q: 5. What is the range of these data points? 6. What is the median of these data points? 7. What is…
A: Hello! As you have posted more than 3 sub parts, we are answering the first 3 sub-parts. In case…
Q: 4. Which of the following factors has the highest positive correlation with life expectancy in some…
A: The correlation coefficient is denoted by R. It is used to measure how strong a…
Q: Given the box-and-whisker plot below, which of these statements are likely to be true? 10 12 14 16…
A:
Q: 2. Below is the fat content of some of our favorite meals. Compute the mean, median, and mode.…
A:
Q: C) Which of the following questions would the researcher not be able to explore using a 2 proportion…
A:
Q: 6. 6. 6. 2 9. For the sample data in the table above, by how much does the data value 4 deviate from…
A: Reviewing information, Given data, x=(6,6,6,4,6,2,9) n=7
Q: 9. Find Lower quartile, Median, Upper quartile, 6th percentile, 4th quartile from the decile, 95th…
A:
Q: Student 3 4 7 8. 9. 10 11 12 Pre test 73 76 45 77 65 44 51 53 78 70 46 79 Post Test 83 89 57 79 75…
A: Solution : The null and alternative hypothesis is given below:Null hypothesis:Ho:Md = 0That is,…
Q: 8) Following are box-and-whisker plots comparing the study times in hours per week for Sarah and…
A: Given a box and whisker plot... Firstly we write the five number summary from this box and whisker…
Q: a) The IQR is a measure of spread of the 50% of a set of data. b) In a set of data that contains 250…
A: Solution-: (a) The IQR is measure of spread of the .....50% of a set of data. (b) In a set of data…
Step by step
Solved in 2 steps with 1 images