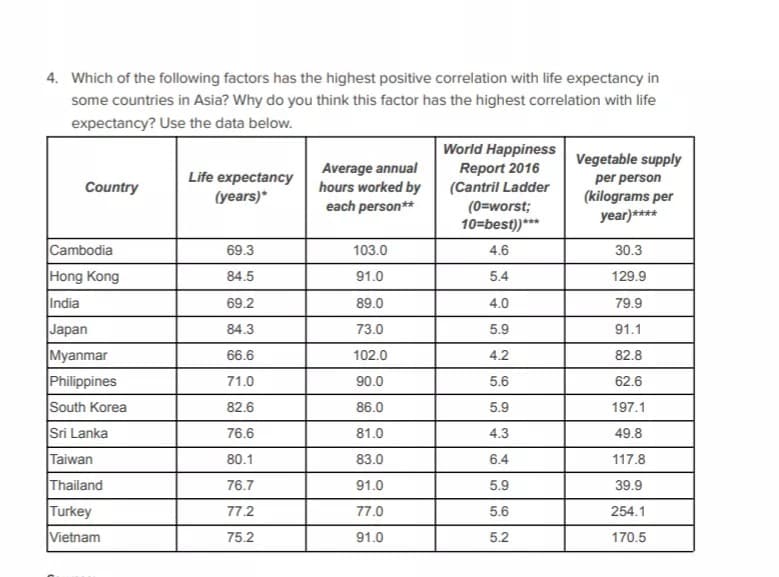
4. Which of the following factors has the highest positive correlation with life expectancy in some countries in Asia? Why do you think this factor has the highest correlation with life expectancy? Use the data below. World Happiness Report 2016 (Cantril Ladder (0=worst; 10=best))*** Vegetable supply Life expectancy (years)* Average annual hours worked by each person** per person Country (kilograms per year)**** Cambodia Hong Kong 69.3 103.0 4.6 30.3 84.5 91.0 5.4 129.9 India 69.2 89.0 4.0 79.9 Japan Myanmar Philippines South Korea 84.3 73.0 5.9 91.1 66.6 102.0 4.2 82.8 71.0 90.0 5.6 62.6 82.6 86.0 5.9 197.1 Sri Lanka 76.6 81.0 4.3 49.8 Taiwan 80.1 83.0 6.4 117.8 Thailand 76.7 91.0 5.9 39.9 Turkey 77.2 77.0 5.6 254.1 Vietnam 75.2 91.0 5.2 170.5


Correlation
Correlation defines a relationship between two independent variables. It tells the degree to which variables move in relation to each other. When two sets of data are related to each other, there is a correlation between them.
Linear Correlation
A correlation is used to determine the relationships between numerical and categorical variables. In other words, it is an indicator of how things are connected to one another. The correlation analysis is the study of how variables are related.
Regression Analysis
Regression analysis is a statistical method in which it estimates the relationship between a dependent variable and one or more independent variable. In simple terms dependent variable is called as outcome variable and independent variable is called as predictors. Regression analysis is one of the methods to find the trends in data. The independent variable used in Regression analysis is named Predictor variable. It offers data of an associated dependent variable regarding a particular outcome.


Trending now
This is a popular solution!

Step by step
Solved in 4 steps with 1 images


