4) Given the following titration curves: A) Which curve represents the titration of a weak base, and which represents the strong base? B) Estimate the pH at the equivalence point for each. C) What can you infer about the concentrations of the two bases? 12 8 9 10 11 24 57 pH¹ S t 3 A wed wo B Volume of titrant added (mL)
4) Given the following titration curves: A) Which curve represents the titration of a weak base, and which represents the strong base? B) Estimate the pH at the equivalence point for each. C) What can you infer about the concentrations of the two bases? 12 8 9 10 11 24 57 pH¹ S t 3 A wed wo B Volume of titrant added (mL)

Chapter15: Complex Acid/base Systems
Section: Chapter Questions
Problem 15.9QAP

Related questions

Question
Thank you so much!
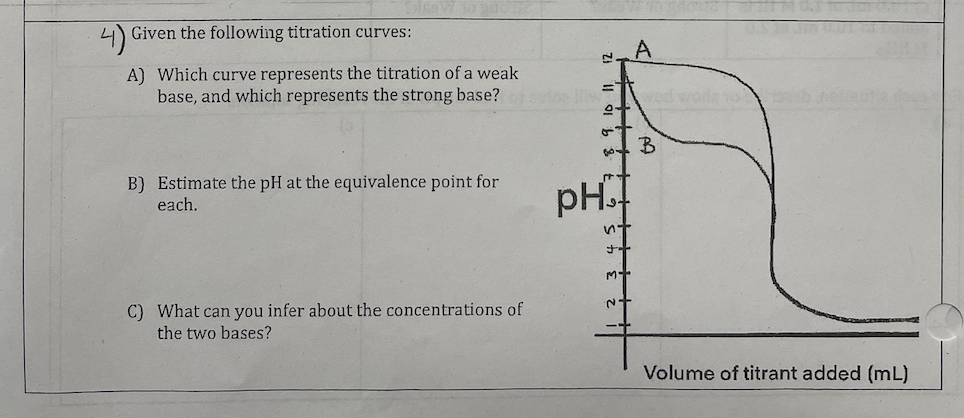
Transcribed Image Text:Given the following titration curves:
A) Which curve represents the titration of a weak
base, and which represents the strong base?
B) Estimate the pH at the equivalence point for
each.
C) What can you infer about the concentrations of
the two bases?
pH™I
nt
++
M+
~+
A
B
Volume of titrant added (mL)
Expert Solution
This question has been solved!
Explore an expertly crafted, step-by-step solution for a thorough understanding of key concepts.

This is a popular solution!

Trending now
This is a popular solution!

Step by step
Solved in 3 steps with 2 images

Knowledge Booster


Learn more about
Need a deep-dive on the concept behind this application? Look no further. Learn more about this topic, chemistry and related others by exploring similar questions and additional content below.Recommended textbooks for you

Chemistry: Principles and Practice
Chemistry
ISBN:
9780534420123
Author:
Daniel L. Reger, Scott R. Goode, David W. Ball, Edward Mercer
Publisher:
Cengage Learning

Chemistry: Principles and Practice
Chemistry
ISBN:
9780534420123
Author:
Daniel L. Reger, Scott R. Goode, David W. Ball, Edward Mercer
Publisher:
Cengage Learning

Chemistry
Chemistry
ISBN:
9781305957404
Author:
Steven S. Zumdahl, Susan A. Zumdahl, Donald J. DeCoste
Publisher:
Cengage Learning

Chemistry: An Atoms First Approach
Chemistry
ISBN:
9781305079243
Author:
Steven S. Zumdahl, Susan A. Zumdahl
Publisher:
Cengage Learning

Chemistry: The Molecular Science
Chemistry
ISBN:
9781285199047
Author:
John W. Moore, Conrad L. Stanitski
Publisher:
Cengage Learning