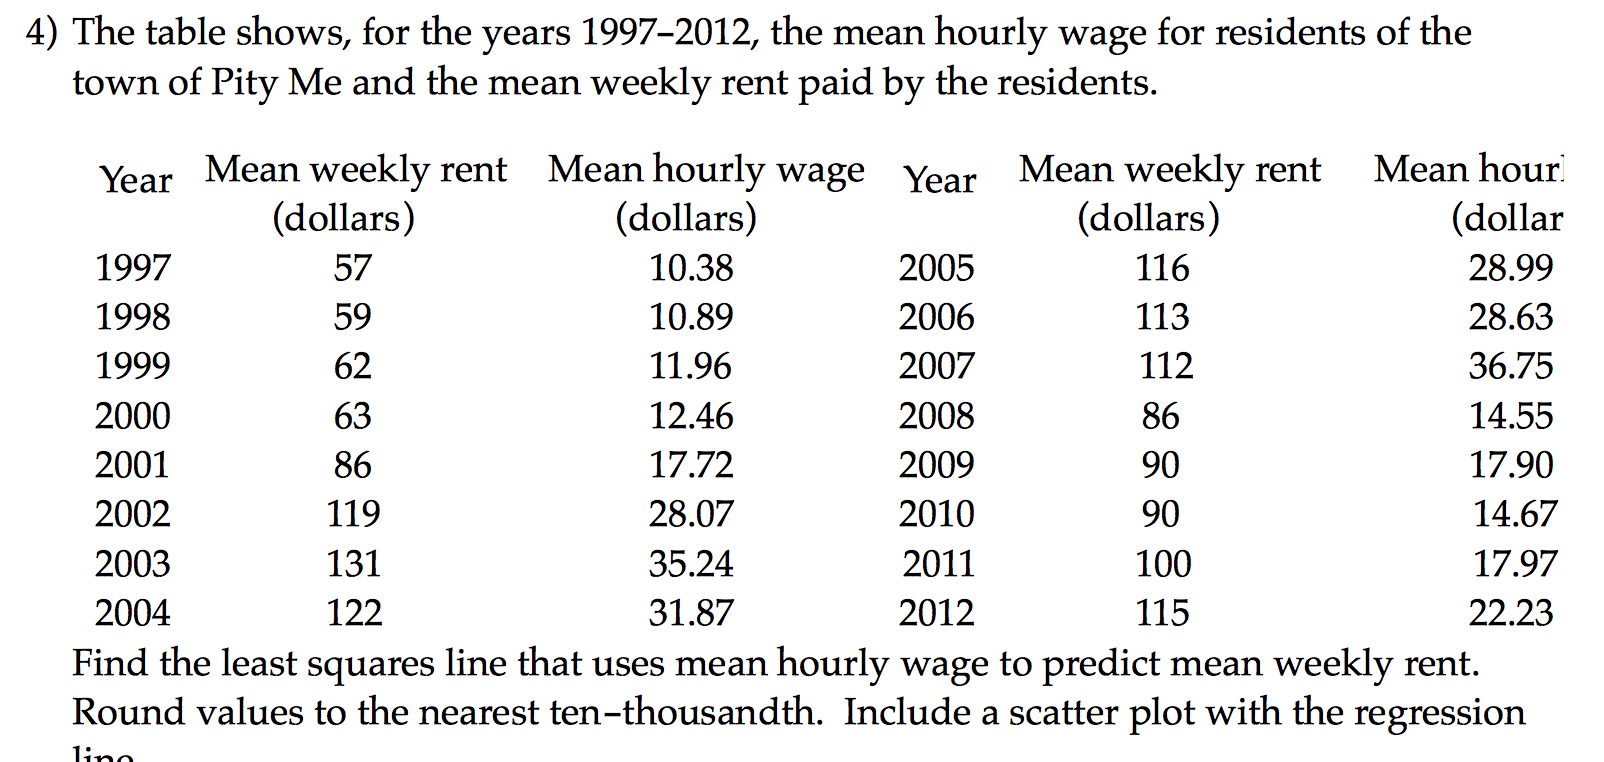
4) The table shows, for the years 1997–2012, the mean hourly wage for residents of the town of Pity Me and the mean weekly rent paid by the residents. Mean hourly wage (dollars) Mean hour. Mean weekly rent (dollars) Mean weekly rent (dollars) Year Year (dollar 116 1997 57 10.38 2005 28.99 59 113 1998 10.89 2006 28.63 2007 1999 62 11.96 112 36.75 14.55 2000 63 12.46 2008 86 17.90 2001 86 17.72 2009 90 2002 2010 119 28.07 90 14.67 131 35.24 2003 2011 17.97 100 122 2004 2012 22.23 31.87 115 Find the least squares line that uses mean hourly wage to predict mean weekly rent. Round values to the nearest ten-thousandth. Include a scatter plot with the regression lino
4) The table shows, for the years 1997–2012, the mean hourly wage for residents of the town of Pity Me and the mean weekly rent paid by the residents. Mean hourly wage (dollars) Mean hour. Mean weekly rent (dollars) Mean weekly rent (dollars) Year Year (dollar 116 1997 57 10.38 2005 28.99 59 113 1998 10.89 2006 28.63 2007 1999 62 11.96 112 36.75 14.55 2000 63 12.46 2008 86 17.90 2001 86 17.72 2009 90 2002 2010 119 28.07 90 14.67 131 35.24 2003 2011 17.97 100 122 2004 2012 22.23 31.87 115 Find the least squares line that uses mean hourly wage to predict mean weekly rent. Round values to the nearest ten-thousandth. Include a scatter plot with the regression lino

Glencoe Algebra 1, Student Edition, 9780079039897, 0079039898, 2018
18th Edition
ISBN:9780079039897
Author:Carter
Publisher:Carter
Chapter10: Statistics
Section10.3: Measures Of Spread
Problem 1GP

Related questions
Question
Transcribed Image Text:4) The table shows, for the years 1997–2012, the mean hourly wage for residents of the
town of Pity Me and the mean weekly rent paid by the residents.
Mean hourly wage
(dollars)
Mean hour.
Mean weekly rent
(dollars)
Mean weekly rent
(dollars)
Year
Year
(dollar
116
1997
57
10.38
2005
28.99
59
113
1998
10.89
2006
28.63
2007
1999
62
11.96
112
36.75
14.55
2000
63
12.46
2008
86
17.90
2001
86
17.72
2009
90
2002
2010
119
28.07
90
14.67
131
35.24
2003
2011
17.97
100
122
2004
2012
22.23
31.87
115
Find the least squares line that uses mean hourly wage to predict mean weekly rent.
Round values to the nearest ten-thousandth. Include a scatter plot with the regression
lino
Expert Solution
This question has been solved!
Explore an expertly crafted, step-by-step solution for a thorough understanding of key concepts.

This is a popular solution!

Trending now
This is a popular solution!

Step by step
Solved in 4 steps with 4 images

Recommended textbooks for you
Glencoe Algebra 1, Student Edition, 9780079039897…
Algebra
ISBN:
9780079039897
Author:
Carter
Publisher:
McGraw Hill
Glencoe Algebra 1, Student Edition, 9780079039897…
Algebra
ISBN:
9780079039897
Author:
Carter
Publisher:
McGraw Hill