Compute for the mean, median, mode, range, variance and standard deviation for the table below. Class Interval f 70-72 67-69 2 4 64-66 61-63 58-60 11 55-57 52-54 49-51 4 2 46-48 1 43-45 1
Compute for the mean, median, mode, range, variance and standard deviation for the table below. Class Interval f 70-72 67-69 2 4 64-66 61-63 58-60 11 55-57 52-54 49-51 4 2 46-48 1 43-45 1

Glencoe Algebra 1, Student Edition, 9780079039897, 0079039898, 2018
18th Edition
ISBN:9780079039897
Author:Carter
Publisher:Carter
Chapter10: Statistics
Section10.5: Comparing Sets Of Data
Problem 2GP

Related questions
Question
complete solution
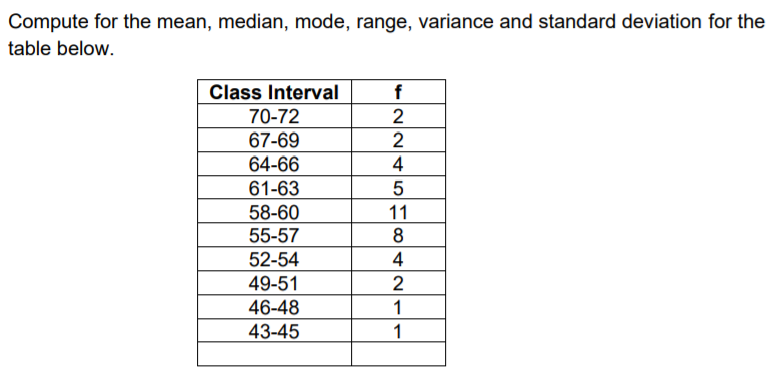
Transcribed Image Text:Compute for the mean, median, mode, range, variance and standard deviation for the
table below.
Class Interval
70-72
2
67-69
2
64-66
4
61-63
5
58-60
11
55-57
8
52-54
4
49-51
2
46-48
1
43-45
1
Expert Solution
This question has been solved!
Explore an expertly crafted, step-by-step solution for a thorough understanding of key concepts.

This is a popular solution!

Trending now
This is a popular solution!

Step by step
Solved in 3 steps

Recommended textbooks for you
Glencoe Algebra 1, Student Edition, 9780079039897…
Algebra
ISBN:
9780079039897
Author:
Carter
Publisher:
McGraw Hill
Glencoe Algebra 1, Student Edition, 9780079039897…
Algebra
ISBN:
9780079039897
Author:
Carter
Publisher:
McGraw Hill