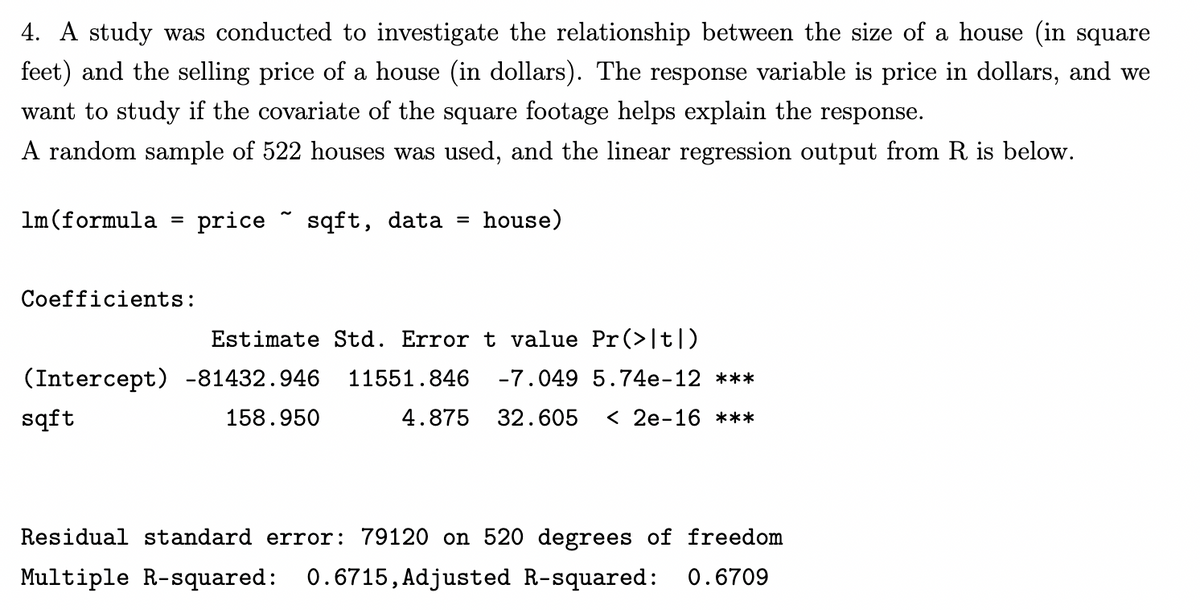
4. A study was conducted to investigate the relationship between the size of a house (in square feet) and the selling price of a house (in dollars). The response variable is price in dollars, and we want to study if the covariate of the square footage helps explain the response. A random sample of 522 houses was used, and the linear regression output from R is below.
4. A study was conducted to investigate the relationship between the size of a house (in square feet) and the selling price of a house (in dollars). The response variable is price in dollars, and we want to study if the covariate of the square footage helps explain the response. A random sample of 522 houses was used, and the linear regression output from R is below.

College Algebra
7th Edition
ISBN:9781305115545
Author:James Stewart, Lothar Redlin, Saleem Watson
Publisher:James Stewart, Lothar Redlin, Saleem Watson
Chapter1: Equations And Graphs
Section: Chapter Questions
Problem 10T: Olympic Pole Vault The graph in Figure 7 indicates that in recent years the winning Olympic men’s...

Related questions
Question
Transcribed Image Text:4. A study was conducted to investigate the relationship between the size of a house (in square
feet) and the selling price of a house (in dollars). The response variable is price in dollars, and we
want to study if the covariate of the square footage helps explain the response.
A random sample of 522 houses was used, and the linear regression output from R is below.
price sqft, data = house)
1m (formula
=
Coefficients:
Estimate Std. Error t value Pr(>|t|)
(Intercept) -81432.946 11551.846 -7.049 5.74e-12 ***
sqft
158.950
4.875 32.605 < 2e-16 ***
Residual standard error: 79120 on 520 degrees of freedom
Multiple R-squared: 0.6715, Adjusted R-squared: 0.6709
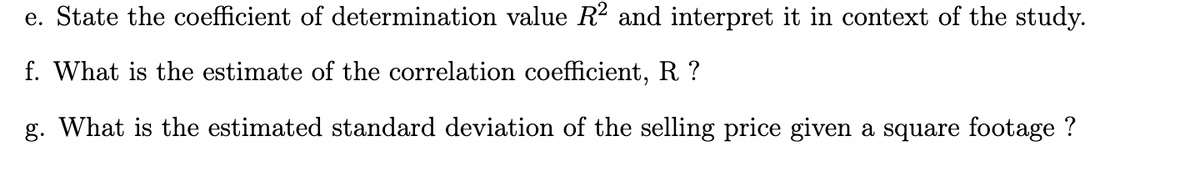
Transcribed Image Text:e. State the coefficient of determination value R² and interpret it in context of the study.
f. What is the estimate of the correlation coefficient, R?
g. What is the estimated standard deviation of the selling price given a square footage ?
Expert Solution
This question has been solved!
Explore an expertly crafted, step-by-step solution for a thorough understanding of key concepts.

This is a popular solution!

Trending now
This is a popular solution!

Step by step
Solved in 5 steps with 3 images

Recommended textbooks for you
College Algebra
Algebra
ISBN:
9781305115545
Author:
James Stewart, Lothar Redlin, Saleem Watson
Publisher:
Cengage Learning

Glencoe Algebra 1, Student Edition, 9780079039897…
Algebra
ISBN:
9780079039897
Author:
Carter
Publisher:
McGraw Hill

Algebra and Trigonometry (MindTap Course List)
Algebra
ISBN:
9781305071742
Author:
James Stewart, Lothar Redlin, Saleem Watson
Publisher:
Cengage Learning
College Algebra
Algebra
ISBN:
9781305115545
Author:
James Stewart, Lothar Redlin, Saleem Watson
Publisher:
Cengage Learning
Glencoe Algebra 1, Student Edition, 9780079039897…
Algebra
ISBN:
9780079039897
Author:
Carter
Publisher:
McGraw Hill
Algebra and Trigonometry (MindTap Course List)
Algebra
ISBN:
9781305071742
Author:
James Stewart, Lothar Redlin, Saleem Watson
Publisher:
Cengage Learning

Functions and Change: A Modeling Approach to Coll…
Algebra
ISBN:
9781337111348
Author:
Bruce Crauder, Benny Evans, Alan Noell
Publisher:
Cengage Learning

Big Ideas Math A Bridge To Success Algebra 1: Stu…
Algebra
ISBN:
9781680331141
Author:
HOUGHTON MIFFLIN HARCOURT
Publisher:
Houghton Mifflin Harcourt