This graph provides the lower tail probabilities for the standard normal distribution. Change the value of z or p in the boxes below to update the graph. When you change one value the other value will update automatically. Observe how the shaded area in the lower tail changes with different values of z or p. 2: -1.645 p: 0.05 p=0.05 2 .586 .893 -1.645 What is the z-score for an upper-tail probability of .10? -1.645 -1.96 1.282 -2.33 What is the probability for the region -1.75 sz s 1.5? .973 .613 0 Created by Gary H. McClelland, Professor Emeritus | University of Colorado Boulder ⒸCengage Learning. All Rights Reserved.
This graph provides the lower tail probabilities for the standard normal distribution. Change the value of z or p in the boxes below to update the graph. When you change one value the other value will update automatically. Observe how the shaded area in the lower tail changes with different values of z or p. 2: -1.645 p: 0.05 p=0.05 2 .586 .893 -1.645 What is the z-score for an upper-tail probability of .10? -1.645 -1.96 1.282 -2.33 What is the probability for the region -1.75 sz s 1.5? .973 .613 0 Created by Gary H. McClelland, Professor Emeritus | University of Colorado Boulder ⒸCengage Learning. All Rights Reserved.

MATLAB: An Introduction with Applications
6th Edition
ISBN:9781119256830
Author:Amos Gilat
Publisher:Amos Gilat
Chapter1: Starting With Matlab
Section: Chapter Questions
Problem 1P

Related questions
Question
Transcribed Image Text:d
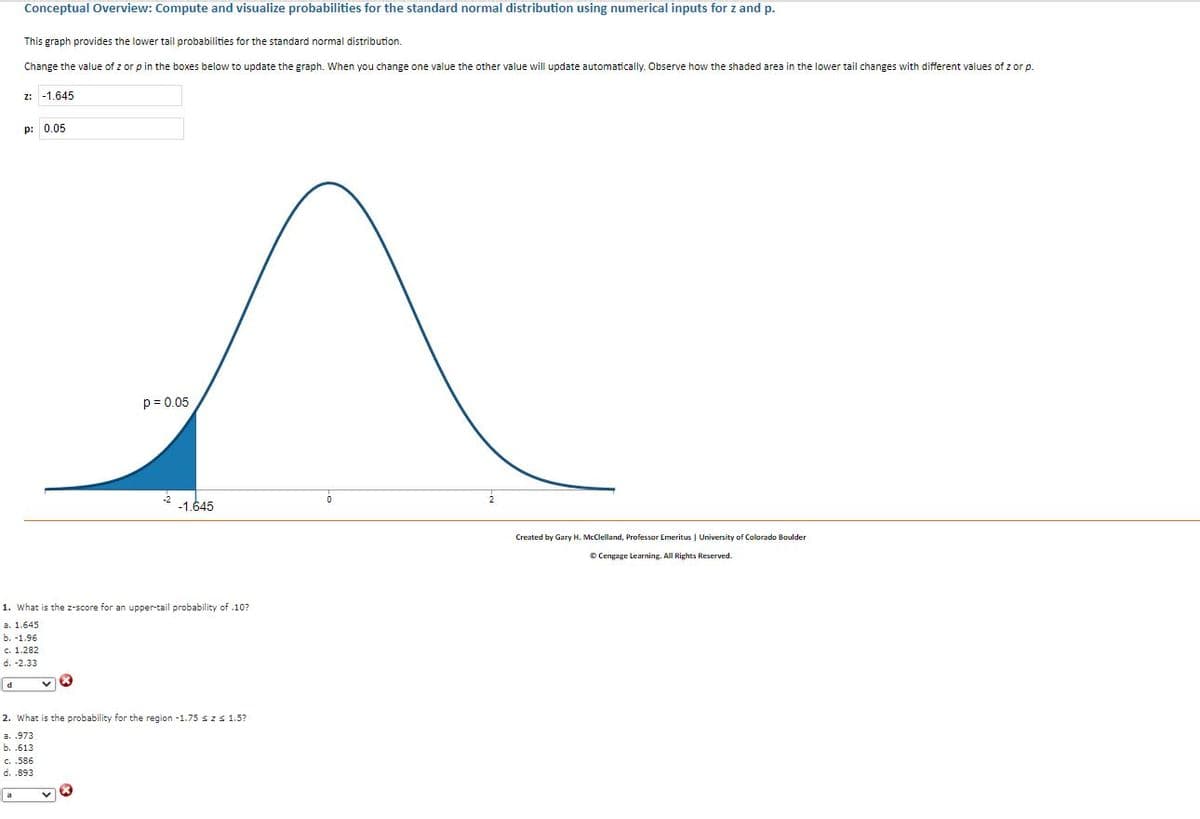
Conceptual Overview: Compute and visualize probabilities for the standard normal distribution using numerical inputs for z and p.
This graph provides the lower tail probabilities for the standard normal distribution.
Change the value of z or p in the boxes below to update the graph. When you change one value the other value will update automatically. Observe how the shaded area in the lower tail changes with different values of z or p.
a
Z: -1.645
p: 0.05
p = 0.05
1. What is the z-score for an upper-tail probability of .10?
a. 1.645
b. -1.96
c. 1.282
d. -2.33
✓X
-2
-1.645
2. What is the probability for the region -1.75 ≤ z ≤ 1.5?
a. .973
b. .613
c. .586
d. .893
6
Created by Gary H. McClelland, Professor Emeritus | University of Colorado Boulder
ⒸCengage Learning. All Rights Reserved.
Expert Solution
This question has been solved!
Explore an expertly crafted, step-by-step solution for a thorough understanding of key concepts.

This is a popular solution!

Trending now
This is a popular solution!

Step by step
Solved in 3 steps with 21 images

Recommended textbooks for you
MATLAB: An Introduction with Applications
Statistics
ISBN:
9781119256830
Author:
Amos Gilat
Publisher:
John Wiley & Sons Inc

Probability and Statistics for Engineering and th…
Statistics
ISBN:
9781305251809
Author:
Jay L. Devore
Publisher:
Cengage Learning

Statistics for The Behavioral Sciences (MindTap C…
Statistics
ISBN:
9781305504912
Author:
Frederick J Gravetter, Larry B. Wallnau
Publisher:
Cengage Learning
MATLAB: An Introduction with Applications
Statistics
ISBN:
9781119256830
Author:
Amos Gilat
Publisher:
John Wiley & Sons Inc
Probability and Statistics for Engineering and th…
Statistics
ISBN:
9781305251809
Author:
Jay L. Devore
Publisher:
Cengage Learning
Statistics for The Behavioral Sciences (MindTap C…
Statistics
ISBN:
9781305504912
Author:
Frederick J Gravetter, Larry B. Wallnau
Publisher:
Cengage Learning

Elementary Statistics: Picturing the World (7th E…
Statistics
ISBN:
9780134683416
Author:
Ron Larson, Betsy Farber
Publisher:
PEARSON

The Basic Practice of Statistics
Statistics
ISBN:
9781319042578
Author:
David S. Moore, William I. Notz, Michael A. Fligner
Publisher:
W. H. Freeman

Introduction to the Practice of Statistics
Statistics
ISBN:
9781319013387
Author:
David S. Moore, George P. McCabe, Bruce A. Craig
Publisher:
W. H. Freeman