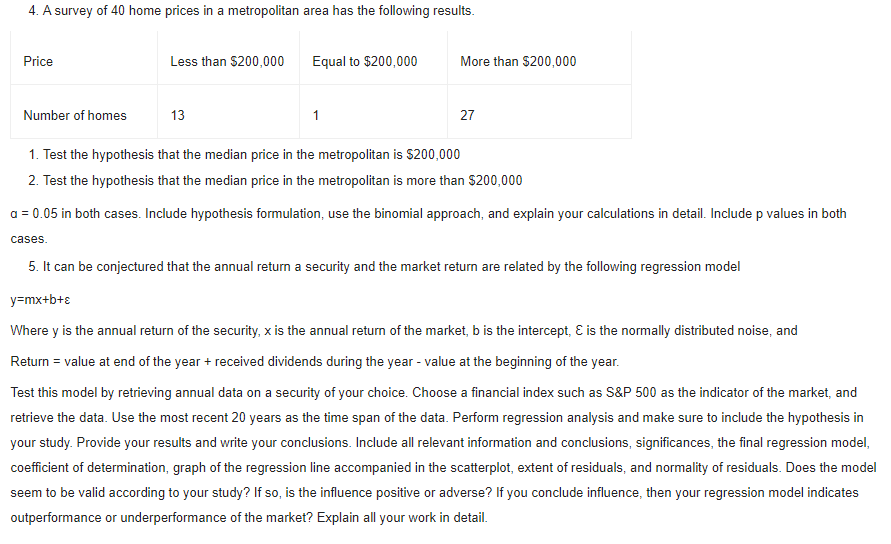
4. A survey of 40 home prices in a metropolitan area has the following results. Price Less than $200,000 Equal to $200,000 More than $200,000 Number of homes 13 1 27 1. Test the hypothesis that the median price in the metropolitan is $200,000 2. Test the hypothesis that the median price in the metropolitan is more than $200,000 a = 0.05 in both cases. Include hypothesis formulation, use the binomial approach, and explain your calculations in detail. Include p values in both cases.
4. A survey of 40 home prices in a metropolitan area has the following results. Price Less than $200,000 Equal to $200,000 More than $200,000 Number of homes 13 1 27 1. Test the hypothesis that the median price in the metropolitan is $200,000 2. Test the hypothesis that the median price in the metropolitan is more than $200,000 a = 0.05 in both cases. Include hypothesis formulation, use the binomial approach, and explain your calculations in detail. Include p values in both cases.

College Algebra
7th Edition
ISBN:9781305115545
Author:James Stewart, Lothar Redlin, Saleem Watson
Publisher:James Stewart, Lothar Redlin, Saleem Watson
Chapter9: Counting And Probability
Section9.3: Binomial Probability
Problem 2E: If a binomial experiment has probability p success, then the probability of failure is...

Related questions

Topic Video
Question
Transcribed Image Text:4. A survey of 40 home prices in a metropolitan area has the following results.
Price
Less than $200,000
Equal to $200,000
More than $200,000
Number of homes
13
1
27
1. Test the hypothesis that the median price in the metropolitan is $200,000
2. Test the hypothesis that the median price in the metropolitan is more than $200,000
a = 0.05 in both cases. Include hypothesis formulation, use the binomial approach, and explain your calculations in detail. Include p values in both
cases.
5. It can be conjectured that the annual return a security and the market return are related by the following regression model
y=mx+b+ɛ
Where y is the annual return of the security, x is the annual return of the market, b is the intercept, E is the normally distributed noise, and
Return = value at end of the year + received dividends during the year - value at the beginning of the year.
Test this model by retrieving annual data on a security of your choice. Choose a financial index such as S&P 500 as the indicator of the market, and
retrieve the data. Use the most recent 20 years as the time span of the data. Perform regression analysis and make sure to include the hypothesis in
your study. Provide your results and write your conclusions. Include all relevant information and conclusions, significances, the final regression model,
coefficient of determination, graph of the regression line accompanied in the scatterplot, extent of residuals, and normality of residuals. Does the model
seem to be valid according to your study? If so, is the influence positive or adverse? If you conclude influence, then your regression model indicates
outperformance or underperformance of the market? Explain all your work in detail.
Expert Solution
This question has been solved!
Explore an expertly crafted, step-by-step solution for a thorough understanding of key concepts.

This is a popular solution!

Trending now
This is a popular solution!

Step by step
Solved in 3 steps

Knowledge Booster


Learn more about
Need a deep-dive on the concept behind this application? Look no further. Learn more about this topic, statistics and related others by exploring similar questions and additional content below.Recommended textbooks for you
College Algebra
Algebra
ISBN:
9781305115545
Author:
James Stewart, Lothar Redlin, Saleem Watson
Publisher:
Cengage Learning
College Algebra
Algebra
ISBN:
9781305115545
Author:
James Stewart, Lothar Redlin, Saleem Watson
Publisher:
Cengage Learning