4. An article in the Joumal of the Environmental Engineering Division ["Least Squares Estimates of BOD Parameters" (1980, Vol. 106, pp. 1197-1202)) took a sample from the Holston River below Kingport. Tennessee, during August 1977. The biochemical oxygen demand (BOD) test is conducted over a period of time in days. The resulting data follow. I 2 4 6 8 10 12 14 16 18 20 Time (days): BOD (mg/liter): 0.6 07 13 19 2.1 26 29 3.7 3.5 3.7 3.8 a What is the estimate of o? b. What is the estimate of expected BOD lovel when ime 15 days?
Q: Question 3 Lot size N-20,000, AQL = 1.5% Normal Tightened Reduced N (Sample Size) Ac Re
A:
Q: m consumer survey, randomly selecte e asked to rank their satisfaction with where higher values…
A: Given, Sample Porsche Mercedes BMW 1 10 8 0 2 8 6 4 3 6 10 2
Q: The median mass of a collection of 8 oranges, some of which have the same mass, is 200 g. If a ninth…
A:
Q: Question 19 A lawyer claims that women are pald less than men for the same work. In a random sample…
A:
Q: The weights of cans of Ocean brand tuna are supposed to have a net weight of 6 ounces. The…
A: Given Mean =5.97 Standard deviation=0.23 n=42
Q: A random sample of 1005 adults in a certain large country was asked "Do you pretty much think…
A: Find confidence interval for proportion Select all the correct blanks
Q: Which is the null hypothesis? O a. There is no significant difference between a person's age and the…
A: For the given what is the null hypothesis ? Select the correct choice
Q: The first worksheet labeled sample A (in the Excel file linked below the exam) is a sample of n=50…
A: Given: i xi 1 0 2 0 3 0 4 0 5 1 6 0 7 0 8 1 9 0 10 0 11 0 12 0 13 0…
Q: Select a Level of Significance, α A 5 percent significance level has been selected. What is the…
A: The level of significance is 0.05.
Q: Question 12 A coin comes up heads 50% of the time. Flip a coin 6 times. What is the probability of…
A: Given,n=6p=0.5q=1-0.5=0.5A random variable X~Binomial(n=6 , p=0.5)P(X=x)=6x0.5x0.56-x ;…
Q: You receive a brochure from a large university. The brochure indicates that the mean class size for…
A: The question is based on a hypo. testing of a popl. mean Given data : Sample size ( n ) = 18 Level…
Q: Determine whether each of the following experiments/situations involve a discrete or a continuous…
A: A discrete random variable: Its value is obtained by counting. A continuous random variable: Its…
Q: Ralph’s Gas Station is running a giveaway promotion. With every fill-up of gasoline, Ralph gives out…
A: It is given that n=7 and p=0.25.
Q: A mechanical press is used to mold shapes for plastic toys. When the machine is adjusted and working…
A:
Q: The Douglas Drug Company claims that its medication takes effect within 13 minutes. The following…
A: Given data: 8.1, 11.6, 9.4, 15.3, 16.2, 11.3, 11.6, 15.3, 13.6, 17.2. Sample size n=10 Claim:…
Q: What's the value of cell B? 24 O 48 O 72 96
A: The value of Cell B =?
Q: The following are the average grade of a sample of 20 Senior High School students for the first…
A: Given: Significance level = 5 % Sample size = 20
Q: ecide whether you can use the normal distribution to approximate the binomial distribution. If you…
A: Given that n =400,p=0.08
Q: Two samples are taken with the following sample means, sizes, and standard deviations ¯x1 = 36 ¯x2 =…
A:
Q: Example 16.5 following frequency distribution: Family income and its percentage spent on food in the…
A:
Q: A car dealer suspects that the weather of the day of the test drive has an effect on the purchasing…
A:
Q: (a) Before Covid the QTI Summer Examinations were invigilated, closed-book exams. The scores on the…
A: From the provided information, it is interpreted that: n (sample size)=35x¯ (sample mean)=5σ (true…
Q: Percent Under 21 Fatal Accidents per 1000 13 2.962 12 0.708 8 0.885 12 1.652 11 2.091 17 2.627 18…
A:
Q: Solve for x. z = 5x-11y olo
A: Ans - Given regression line z = 5x - 11y
Q: Complete the rest of the table by filling in the expected frequencies
A: Test is that whether every season has the same number of babies born each year.
Q: A credit card company claims that the mean credit card debt for individuals is greater than $4,900.…
A: Given n=38 Standard deviations=600 Mean=5050
Q: 28. Below is a relative frequency bar chart of the number of children in American households. The…
A: Since you have posted a question with multiple subparts, we will solve first three subparts for you.…
Q: Question 9 A Generalised Extreme Value distribution with parameters below has been selected for…
A:
Q: A bag contains four red marbles six blue marbles and two green marbles if two marbles are drawn out…
A:
Q: The number of chocolate chips in an 18-ounce bag of chocolate chip cookies is approximately normally…
A: As per company guidelines I solved exactly three subparts of the question
Q: Age(x) 8 15 22 27 34 40 Sleep (y) 8 8 7 7 6.
A: The given table is x y 8 8 15 8 22 7 27 7 34 5 40 6
Q: Use the frequency distribution shown below to construct an expanded frequency distribution. High…
A: Given data is Class 15-25 26-36 37-47 48-58 59-69 70-80 81-91 Frequency,f 18 45 66 67 80 66 23
Q: The surface of a circular dart board has a small center circle called the bull's-eye and 20…
A: Given If a person hits the bull's-eye with probability 0.01 hits a double with probability 0.10,…
Q: A lawyer claims that women are paid less than men for work. In a random sample of 35 men, the…
A: The population standard deviations are $2000.
Q: 91 88 93 95 95 85 89 93 89 91 91 92 89 89 84 87 88 88 89 93
A: given data : 91,88,93,95,95,85,89,93,89,91,91,92,89,89,84,87,88,88,89,93 from the above…
Q: The third worksheet labeled sample B is a simple random sample with replacement, with seven…
A: Given data: 74.2, 72.79, 70.35, 74.37, 73.34, 78.96, 77.99 The objective is to compute the lower…
Q: The time spent waiting in the line is approximately normally distributed. The mean waiting time is 4…
A: According to the given information in this question We need to find the probability that a person…
Q: You wish to test the following claim (Ha) at a significance level of α=0.10 Ho:p1=p2…
A:
Q: For the given data, (a) find the test statistic, (b) find the standardized test statistic, (c)…
A: Given n1=40 n2=60
Q: 11. The probability that it will snow on any particular day in January is 0.3. Use the Binomial…
A: Ans- The probability that it will snow on any particular day in January is 0.3 i.e P = 0.3 and n…
Q: A researcher gathered a sample of participants who volunteered for a studying of phobias. She…
A: Given that a researcher gathered a sample of participants who volunteered for a studying of phobias.…
Q: 27. This problem is about probabilities and coin flipping. The goal is to compare the probability of…
A: See the attachment please....
Q: From an F-table or using Excel, you can infer that the p-value is O Less than 0.01 Between 0.01 and…
A: Step by step procedure to ANOVA table using EXCEL: In Excel sheet, enter Porsche, Mercedes and BMW…
Q: A researcher is interested in investigating whether the military branch a person signs up for and…
A: A researcher is interested in investigating whether the military branch a person signs up for and…
Q: Question 14 A random sample of 80 people is taken and 60 of them said they are late to work on…
A: We have given that n = 80 Favourable cases= 60
Q: In a survey, 12 people were asked how much they spent on their child's last birthday gift. The…
A:
Q: Example 16.4 The data given in Table 16.4 are used to calculate the correlation coefficient. Table…
A:
Q: After gathering data about the number of starfish and measuring the pollution in areas of the ocean…
A:
Q: Part a) What is the expected number of policies that will pay out before the insured parties have…
A: here given , A life insurance salesman operates on the premise that the probability that a man…
Q: A set of data has the following proporties: mean = 17, median = 15, mode = 14. Which of the…
A:
Subject: Applied statistics and probability for engineers
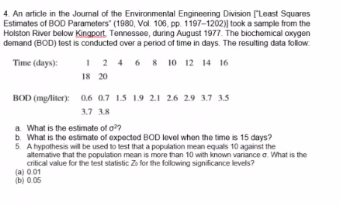
Trending now
This is a popular solution!
Step by step
Solved in 2 steps with 1 images
- An article included a summary of findings regarding the use of SAT I scores, SAT II scores, and high school grade point average (GPA) to predict first-year college GPA. The article states that "among these, SAT II scores are the best predictor, explaining 17 percent of the variance in first-year college grades. GPA was second at 15.2 percent, and SAT I was last at 13.1 percent." If the data from this study were used to fit a least squares line with y = first-year college GPA and x = high school GPA, what would the value of r2 have been? R2 ____________________%Suppose 5 out of 25 data points in a weighted least-squares problem have a y-measurement that is less reliable than the others, and they are to be weighted half as much as the other 20 points. One method is to weight the 20 points by a factor of 1 and the other 5 by a factor of 1/2. A second method is to weight the 20 points by a factor of 2 and the other 5 by a factor of 1. Do the two methods produce different results? Explain.1. An article included a summary of findings regarding the use of SAT I scores, SAT II scores, and high school grade point average (GPA) to predict first-year college GPA. The article states that "among these, SAT II scores are the best predictor, explaining 17 percent of the variance in first-year college grades. GPA was second at 15.3 percent, and SAT I was last at 13.6 percent." If the data from this study were used to fit a least squares line with y = first-year college GPA and x = high school GPA, what would the value of r2 have been? r2 =_______ 2. A study was carried out to investigate the relationship between the hardness of molded plastic (y, in Brinell units) and the amount of time elapsed since the plastic was molded (x, in hours). Summary quantities include n = 15, SSResid = 1,237.628, and SSTo = 24,619.737. Calculate and interpret the coefficient of determination. (Round the coefficient of determination to four decimal places when written as a decimal and 2 decimal…
- The shape of the mean-variance frontier that results from the combination of a riskless and arisky asset is…..:a. Is U-shaped, tilted 90 degrees clockwise.b. Is a straight line passing from the mean-variance points of the two assets.c. Is a hyperbola.d. Consists of two straight lines, each connecting one of the two assets to a risk-freeportfolioWhen we use a least-squares line to predict y values for x values beyond the range of x values found in the data, are we extrapolating or interpolating? Are there any concerns about such predictions?The following table shows the percent of water and the number of calories in various canned soups to which 100 g of water are added. (show all the necessary solution) Percent Water in Soups % Water Calories 83.3 28 92.3 26 91.9 39 89.4 57 89.5 57 90.5 36 91.9 32 91.7 32 a. Find the equation of the least squares line for the data. b. Use the equation in part a to find the expected number of calories in a soup that is 87% water. c. Determine the correlation coefficient of the data.
- Suppose a doctor measures the height, x, and head circumference, y, of 11 children and obtains the data below. The correlation coefficient is 0.904 and the least squares regression line is y=0.208x+11.736. Complete parts (a) and (b) below.A problem with a telephone line that prevents a customer from receiving or making calls is upsetting to both the customer and the telephone company. The Sheet 8 contains samples of 20 problems reported to two different offices of a telephone company and the time to clear these problems (in minutes) from the customers' lines: test the Null hypothesis that the time to clear the problem doesn't significantly differ across to centers at the 0.03 level. Sheet 8 Location 1. Location 2 1,48 7,55 1,75 3,75 0,78 12,00 2,85 1,10 0,52 0,60 1,60 0,52 4,15 3,30 3,97 2,10 1,48 0,58 3,10 13,00 1,02 3,75 0,53 0,65 0,93 1,92 1,60 0,60 0,80 1,53 1,05 4,23 6,32…under which conditions measuremnt error is problematic in terms of bias and inconsistency of the ordinary least squares(OLS) estimator.
- Suppose a special type of small data processing firm is so specialized that some have difficulty making a profit in their first year of operation. what is the value of k?When using the least-squares line for prediction, are results more reliable for extrapolation or interpolation? a. Interpolation, because we are predicting from data outside the range used to create the least-squares line. b. Extrapolation, because we are predicting from data outside the range used to create the least-squares line. c. Extrapolation, because we are predicting from data in the range used to create the least-squares line. d. Interpolation, because we are predicting from data in the range used to create the least-squares line.9 What particular aspects of the SPSS output would you look at to make your decision about the best model?