You receive a brochure from a large university. The brochure indicates that the mean class size for full-time faculty is fewer than 32 students. You want to test this claim. You randomly select 18 classes taught by full-time faculty and determine the class size of each. The results are shown in the table below. At a = 0.10, can you support the university's claim? Complete parts (a) through (d) below. Assume the population is normally distributed. 34 26 26 31 35 41 23 24 270 25 32 38 34 29 29 28 27 25 (a) Write the claim mathematically and identify Ho and H. Which of the following correctly states Ho and H,? OA. Ho: us32 H:u> 32 OC. Ho: H<32 O B. Ho: H232 HiH<32 H: p232 OF. Ho: H> 32 OD. Ho: H=32 Hg:u<32 OE. Ho: H= 32 H:u#32 H: us32 (b) Use technology to find the P-value. P= (Round to three decimal places as needed.) (c) Decide whether to reject or fail to reject the null hypothesis. Which of the following is correct? O A. Fail to reject H, because the P-value is less than the significance level. O B. Reject H, because the P-value is less than the significance level. OC. Reject H, because the P-value is greater than the significance level. O D. Fail to reject Ho because the P-value is greater than the significance level. (d) Interpret the decision in the context of the original claim.
You receive a brochure from a large university. The brochure indicates that the mean class size for full-time faculty is fewer than 32 students. You want to test this claim. You randomly select 18 classes taught by full-time faculty and determine the class size of each. The results are shown in the table below. At a = 0.10, can you support the university's claim? Complete parts (a) through (d) below. Assume the population is normally distributed. 34 26 26 31 35 41 23 24 270 25 32 38 34 29 29 28 27 25 (a) Write the claim mathematically and identify Ho and H. Which of the following correctly states Ho and H,? OA. Ho: us32 H:u> 32 OC. Ho: H<32 O B. Ho: H232 HiH<32 H: p232 OF. Ho: H> 32 OD. Ho: H=32 Hg:u<32 OE. Ho: H= 32 H:u#32 H: us32 (b) Use technology to find the P-value. P= (Round to three decimal places as needed.) (c) Decide whether to reject or fail to reject the null hypothesis. Which of the following is correct? O A. Fail to reject H, because the P-value is less than the significance level. O B. Reject H, because the P-value is less than the significance level. OC. Reject H, because the P-value is greater than the significance level. O D. Fail to reject Ho because the P-value is greater than the significance level. (d) Interpret the decision in the context of the original claim.

Glencoe Algebra 1, Student Edition, 9780079039897, 0079039898, 2018
18th Edition
ISBN:9780079039897
Author:Carter
Publisher:Carter
Chapter10: Statistics
Section10.5: Comparing Sets Of Data
Problem 14PPS

Related questions
Question
Part D is in the second picture thank you!
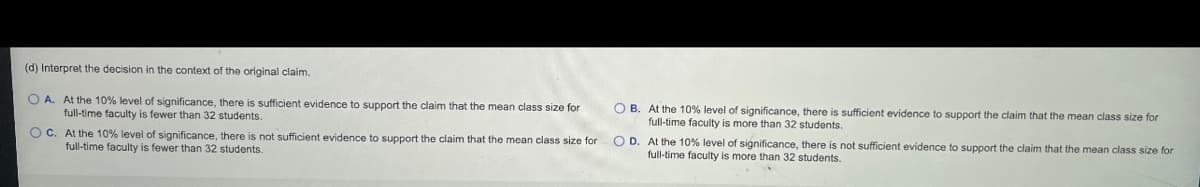
Transcribed Image Text:(d) Interpret the decision in the context of the original claim.
O A. At the 10% level of significance, there is sufficient evidence to support the claim that the mean class size for
full-time faculty is fewer than 32 students.
O B. At the 10% level of significance, there is sufficient evidence to support the claim that the mean class size for
full-time faculty is more than 32 students.
O C. At the 10% level of significance, there is not sufficient evidence to support the claim that the mean class size for
full-time faculty is fewer than 32 students.
O D. At the 10% level of significance, there is not sufficient evidence to support the claim that the mean class size for
full-time faculty is more than 32 students.
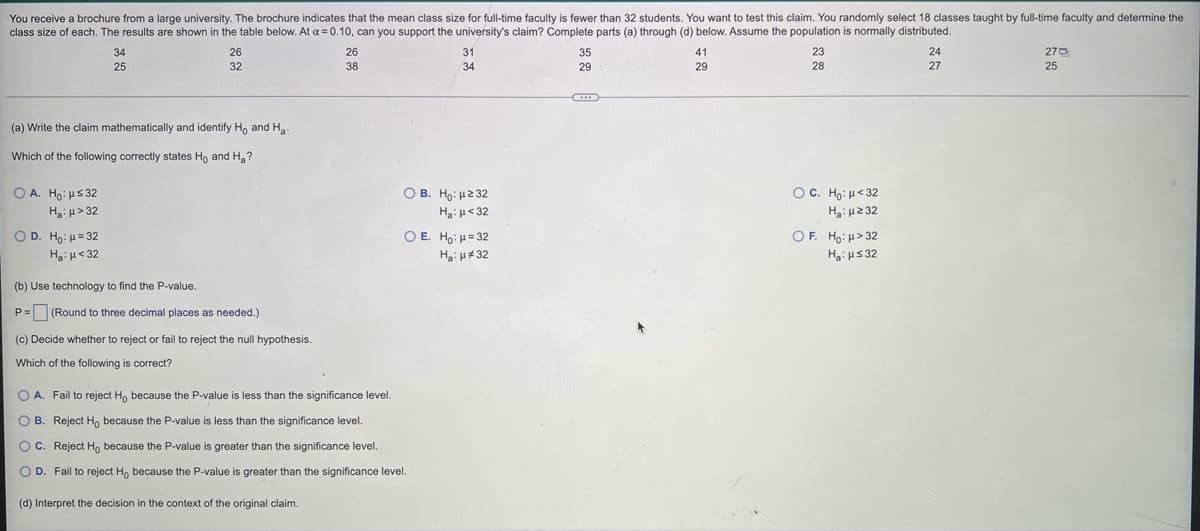
Transcribed Image Text:You receive a brochure from a large university. The brochure indicates that the mean class size for full-time faculty is fewer than 32 students. You want to test this claim. You randomly select 18 classes taught by full-time faculty and determine the
class size of each. The results are shown in the table below. At a = 0.10, can you support the university's claim? Complete parts (a) through (d) below. Assume the population is normally distributed.
34
26
26
31
35
41
23
24
270
25
32
38
34
29
29
28
27
25
....
(a) Write the claim mathematically and identify Ho and Ha
Which of the following correctly states Ho and Ha?
O A. Ho: H5 32
Haiu> 32
O C. Ho: H<32
Ha: H2 32
O B. Ho: H232
Ha:u< 32
O E. Ho: H= 32
HaiH# 32
O D. Ho: H= 32
OF. Ho: H> 32
HaiH532
Hạ: p< 32
(b) Use technology to find the P-value.
P= (Round to three decimal places as needed.)
(c) Decide whether to reject or fail to reject the null hypothesis.
Which of the following is correct?
O A. Fail to reject H, because the P-value is less than the significance level.
O B. Reject H, because the P-value is less than the significance level.
OC. Reject Ho because the P-value is greater than the significance level.
O D. Fail to reject H, because the P-value is greater than the significance level.
(d) Interpret the decision in the context of the original claim.
Expert Solution
This question has been solved!
Explore an expertly crafted, step-by-step solution for a thorough understanding of key concepts.

Step by step
Solved in 2 steps with 1 images

Recommended textbooks for you
Glencoe Algebra 1, Student Edition, 9780079039897…
Algebra
ISBN:
9780079039897
Author:
Carter
Publisher:
McGraw Hill
Glencoe Algebra 1, Student Edition, 9780079039897…
Algebra
ISBN:
9780079039897
Author:
Carter
Publisher:
McGraw Hill