4. Analyze the given vertical analysis and compute for the quick ratio. * In Pesos In Percent 500,000 Cash Short-term Investments 2 Receivables Inventories 600,000 8. 100,000 Prepaid and Other Current Assets Total Current Assets Total Noncurrent Assets 6,000,000 75 Total Assets Current Liabilities Noncurrent Liabilities 40 3,200,000 Equity Total Liabilities and Equity
4. Analyze the given vertical analysis and compute for the quick ratio. * In Pesos In Percent 500,000 Cash Short-term Investments 2 Receivables Inventories 600,000 8. 100,000 Prepaid and Other Current Assets Total Current Assets Total Noncurrent Assets 6,000,000 75 Total Assets Current Liabilities Noncurrent Liabilities 40 3,200,000 Equity Total Liabilities and Equity

Intermediate Accounting: Reporting And Analysis
3rd Edition
ISBN:9781337788281
Author:James M. Wahlen, Jefferson P. Jones, Donald Pagach
Publisher:James M. Wahlen, Jefferson P. Jones, Donald Pagach
Chapter4: The Balance Sheet And The Statement Of Shareholders' Equity
Section: Chapter Questions
Problem 16P: Ratios Analyses: McCormick Refer to the information for McCormick above. Additional information for...

Related questions
Question
Practice Pack
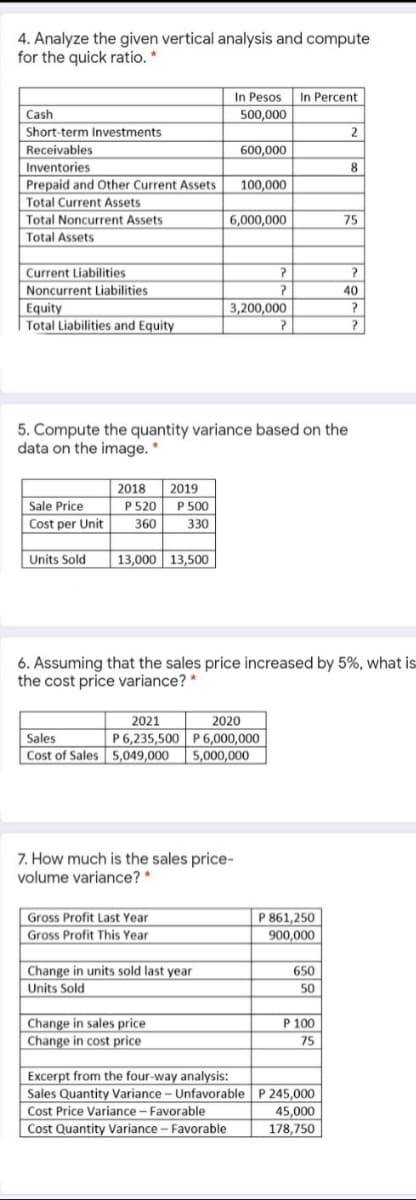
Transcribed Image Text:4. Analyze the given vertical analysis and compute
for the quick ratio. *
In Pesos In Percent
500,000
Cash
Short-term Investments
2
Receivables
600,000
Inventories
8
Prepaid and Other Current Assets
100,000
Total Current Assets
Total Noncurrent Assets
6,000,000
75
Total Assets
Current Liabilities
?
Noncurrent Liabilities
Equity
Total Liabilities and Equity
40
3,200,000
5. Compute the quantity variance based on the
data on the image.
2018
Sale Price
Cost per Unit
2019
P 520 P 500
330
360
Units Sold
13,000 13,500
6. Assuming that the sales price increased by 5%, what is
the cost price variance? *
2021
P 6,235,500| P 6,000,000
Cost of Sales 5,049,000 5,000,000
2020
Sales
7. How much is the sales price-
volume variance? *
P 861,250
900,000
Gross Profit Last Year
Gross Profit This Year
Change in units sold last year
Units Sold
650
50
P 100
Change in sales price
Change in cost price
75
Excerpt from the four-way analysis:
Sales Quantity Variance - Unfavorable P 245,000
Cost Price Variance - Favorable
45,000
Cost Quantity Variance - Favorable
178,750
Expert Solution
This question has been solved!
Explore an expertly crafted, step-by-step solution for a thorough understanding of key concepts.

Includes step-by-step video

Learn your way
Includes step-by-step video

Step by step
Solved in 4 steps

Knowledge Booster


Learn more about
Need a deep-dive on the concept behind this application? Look no further. Learn more about this topic, accounting and related others by exploring similar questions and additional content below.Recommended textbooks for you
Intermediate Accounting: Reporting And Analysis
Accounting
ISBN:
9781337788281
Author:
James M. Wahlen, Jefferson P. Jones, Donald Pagach
Publisher:
Cengage Learning
Intermediate Accounting: Reporting And Analysis
Accounting
ISBN:
9781337788281
Author:
James M. Wahlen, Jefferson P. Jones, Donald Pagach
Publisher:
Cengage Learning