Determine the following measures for 20Y2, rounding to one decimal place including percentages, except for per-share amounts. 1. Working Capital 2. Current Ratio 3. Quick Ratio 4. Accounts Receivable Turnover 5. Number of days' sales in receivables 6. Inventory Turnover 7. Number of days' sales in inventory 8. Ratio of fixed assets to long-term liabilities 9. Ratio of liabilities to stockholder's equity 10. Times interest earned 11. Asset Turnover 12. Return on Total Assets 13. Return on Stockholder's Equity 14. Return on Common Stock 15. Earnings per share on Common Stock 16. Price-earnings ratio 17. Dividends per share of Common Stock 18. Dividend Yield
Determine the following measures for 20Y2, rounding to one decimal place including percentages, except for per-share amounts. 1. Working Capital 2. Current Ratio 3. Quick Ratio 4. Accounts Receivable Turnover 5. Number of days' sales in receivables 6. Inventory Turnover 7. Number of days' sales in inventory 8. Ratio of fixed assets to long-term liabilities 9. Ratio of liabilities to stockholder's equity 10. Times interest earned 11. Asset Turnover 12. Return on Total Assets 13. Return on Stockholder's Equity 14. Return on Common Stock 15. Earnings per share on Common Stock 16. Price-earnings ratio 17. Dividends per share of Common Stock 18. Dividend Yield
Determine the following measures for 20Y2, rounding to one decimal place including percentages, except for per-share amounts. 1. Working Capital 2. Current Ratio 3. Quick Ratio 4. Accounts Receivable Turnover 5. Number of days' sales in receivables 6. Inventory Turnover 7. Number of days' sales in inventory 8. Ratio of fixed assets to long-term liabilities 9. Ratio of liabilities to stockholder's equity 10. Times interest earned 11. Asset Turnover 12. Return on Total Assets 13. Return on Stockholder's Equity 14. Return on Common Stock 15. Earnings per share on Common Stock 16. Price-earnings ratio 17. Dividends per share of Common Stock 18. Dividend Yield
Please Help! I am struggling so much with this chapter.
Instructions:
Determine the following measures for 20Y2, rounding to one decimal place including percentages, except for per-share amounts.
1. Working Capital
2. Current Ratio
3. Quick Ratio
4. Accounts Receivable Turnover
5. Number of days' sales in receivables
6. Inventory Turnover
7. Number of days' sales in inventory
8. Ratio of fixed assets to long-term liabilities
9. Ratio of liabilities to stockholder's equity
10. Times interest earned
11. Asset Turnover
12. Return on Total Assets
13. Return on Stockholder's Equity
14. Return on Common Stock
15. Earnings per share on Common Stock
16. Price-earnings ratio
17. Dividends per share of Common Stock
18. Dividend Yield
Transcribed Image Text:för prepaid expenses, $200,000.
जत 80
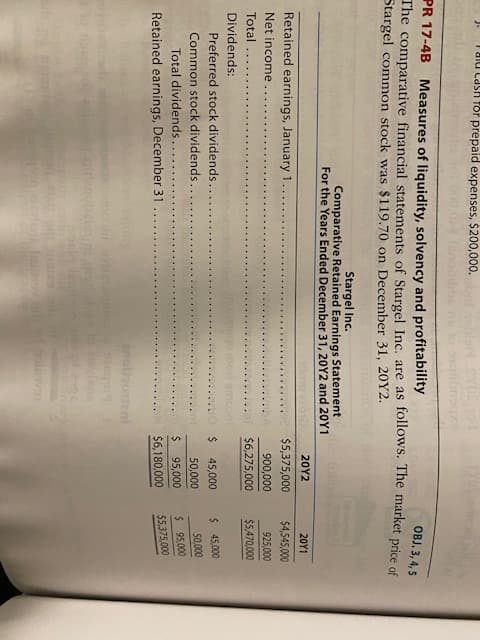
PR 17-4B Measures of liquidity, solvency and profitability
The comparative financial statements of Stargel Inc. are as follows. The market price of
Stargel common stock was $119.70 on December 31, 20Y2.
OBJ. 3, 4, 5
Stargel Inc.
Comparative Retained Earnings Statement
For the Years Ended December 31, 20Y2 and 20Y1
20Y2
20Υ1
Retained earnings, January 1
$5,375,000
$4,545,000
Net income
900,000
925,000
Total
246,275,000
$5,470,000
Dividends:
Preferred stock dividends
2$
45,000
$ 45,000
Common stock dividends..
50,000
50,000
Total dividends..
%24
95,000
$ 95,000
Retained earnings, December 31
$6,180,000
$5,375,000
dent
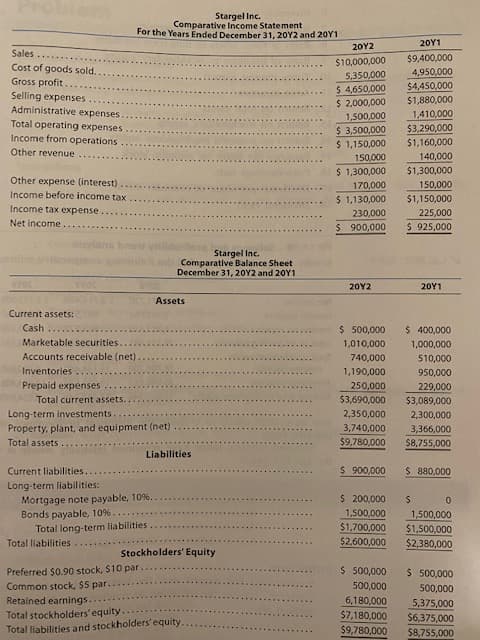
Transcribed Image Text:Stargel Inc.
Comparative Income Statement
For the Years Ended December 31, 20Y2 and 20Y1
20Y1
20Y2
Sales
$9,400,000
000'000'0LS
000'056'v
Gross profit.
Selling expenses
pos spoob jo 150)
000'osE'S
$4,450,000
$1,880,000
000'000'z $
$ 4,650,000
Administrative expenses
Total operating expenses
Income from operations
1,410,000
1,500,000
$ 3,500,000
$ 1,150,000
000'06Z'ES
000'091'1S
000'0v1
Other revenue
000'osL
$1,300,000
$ 1,300,000
Other expense (interest)
Income before income tax
000'0L
$1,150,000
000'0s1
$ 1,130,000
Income tax expense
225,000
Net income
000'0EZ
000'006 S
$ 925,000
Stargel Inc.
Comparative Balance Sheet
December 31, 20Y2 and 20Y1
20Y2
LAOZ
Assets
Current assets:
Cash
$ 500,000
Marketable securities.
000'00v $
1,010,000
000'000'L
Accounts receivable (net)
740,000
000'0LS
Inventories...
1,190,000
000'0s6
Prepaid expenses
250,000
000'627
Total current assets.
000'069'ES
000'680'ES
Long-term investments
2,350,000
000'00E'7
Property, plant, and equipment (net)
Total assets
3,740,000
3,366,000
000'08L'6$
%248,755,000
Liabilities
Current liabilities
000'006 $
000'088 $
Long-term liabilities:
Mortgage note payable, 10%.
Bonds payable, 10%
Total long-term liabilities
Total liabilities
1,500,000
000'00s'L
000'002'LS
000'009
$2,380,000
000'00s'LS
Stockholders' Equity
Preferred $0.90 stock, $10 par.
Common stock, $5 par.
000'00s $
$ 500,000
000'00s
000'08L'9
5,375,000
$6,375,000
Retained earnings.
000'00s
Total stockholders' equity.
Total liabilities and stockholders'equity.
$7,180,000
$8,755,000
000'08L'6S
Definition Definition Money that the business will be receiving from its clients who have utilized the credit provided to buy its goods and services. The credit period typically lasts for a short term, lasting from a few days, a few months, to a year.
Expert Solution
This question has been solved!
Explore an expertly crafted, step-by-step solution for a thorough understanding of key concepts.
Need a deep-dive on the concept behind this application? Look no further. Learn more about this topic, accounting and related others by exploring similar questions and additional content below.