4. Consider the following data for the decomposition reaction: 2H-0 (1) + О2 (g) 2H2O2 (1) Time (sec) Concentration of H,O2(mol/L) Log of Concentration 0 2.32 0.37 300 1.86 0.27 600 1.49 0.17 1200 0.98 -0.01 1800 0.62 -0.21 3000 0.25 -0.60 a) Prepare a graph of concentration versus time. This graph must be done by hand on graph рaper. b) Prepare a graph of log of concentration versus time. This graph may be done on the computer or by hand on graph paper. If you plot the graph using the computer, you must show grids. c) Which of these two graphs (a or b) is a straight line? d) Determine the equation for the straight line produced in "a" or "b".
4. Consider the following data for the decomposition reaction: 2H-0 (1) + О2 (g) 2H2O2 (1) Time (sec) Concentration of H,O2(mol/L) Log of Concentration 0 2.32 0.37 300 1.86 0.27 600 1.49 0.17 1200 0.98 -0.01 1800 0.62 -0.21 3000 0.25 -0.60 a) Prepare a graph of concentration versus time. This graph must be done by hand on graph рaper. b) Prepare a graph of log of concentration versus time. This graph may be done on the computer or by hand on graph paper. If you plot the graph using the computer, you must show grids. c) Which of these two graphs (a or b) is a straight line? d) Determine the equation for the straight line produced in "a" or "b".

Chemistry by OpenStax (2015-05-04)
1st Edition
ISBN:9781938168390
Author:Klaus Theopold, Richard H Langley, Paul Flowers, William R. Robinson, Mark Blaser
Publisher:Klaus Theopold, Richard H Langley, Paul Flowers, William R. Robinson, Mark Blaser
Chapter5: Thermochemistry
Section: Chapter Questions
Problem 66E: Calculate H298 for the process Co3O4(s)3Co(s)+2O2(g) from the following information:...

Related questions
Question

Transcribed Image Text:4. Consider the following data for the decomposition reaction:
2H-0 (1) + О2 (g)
2H2O2 (1)
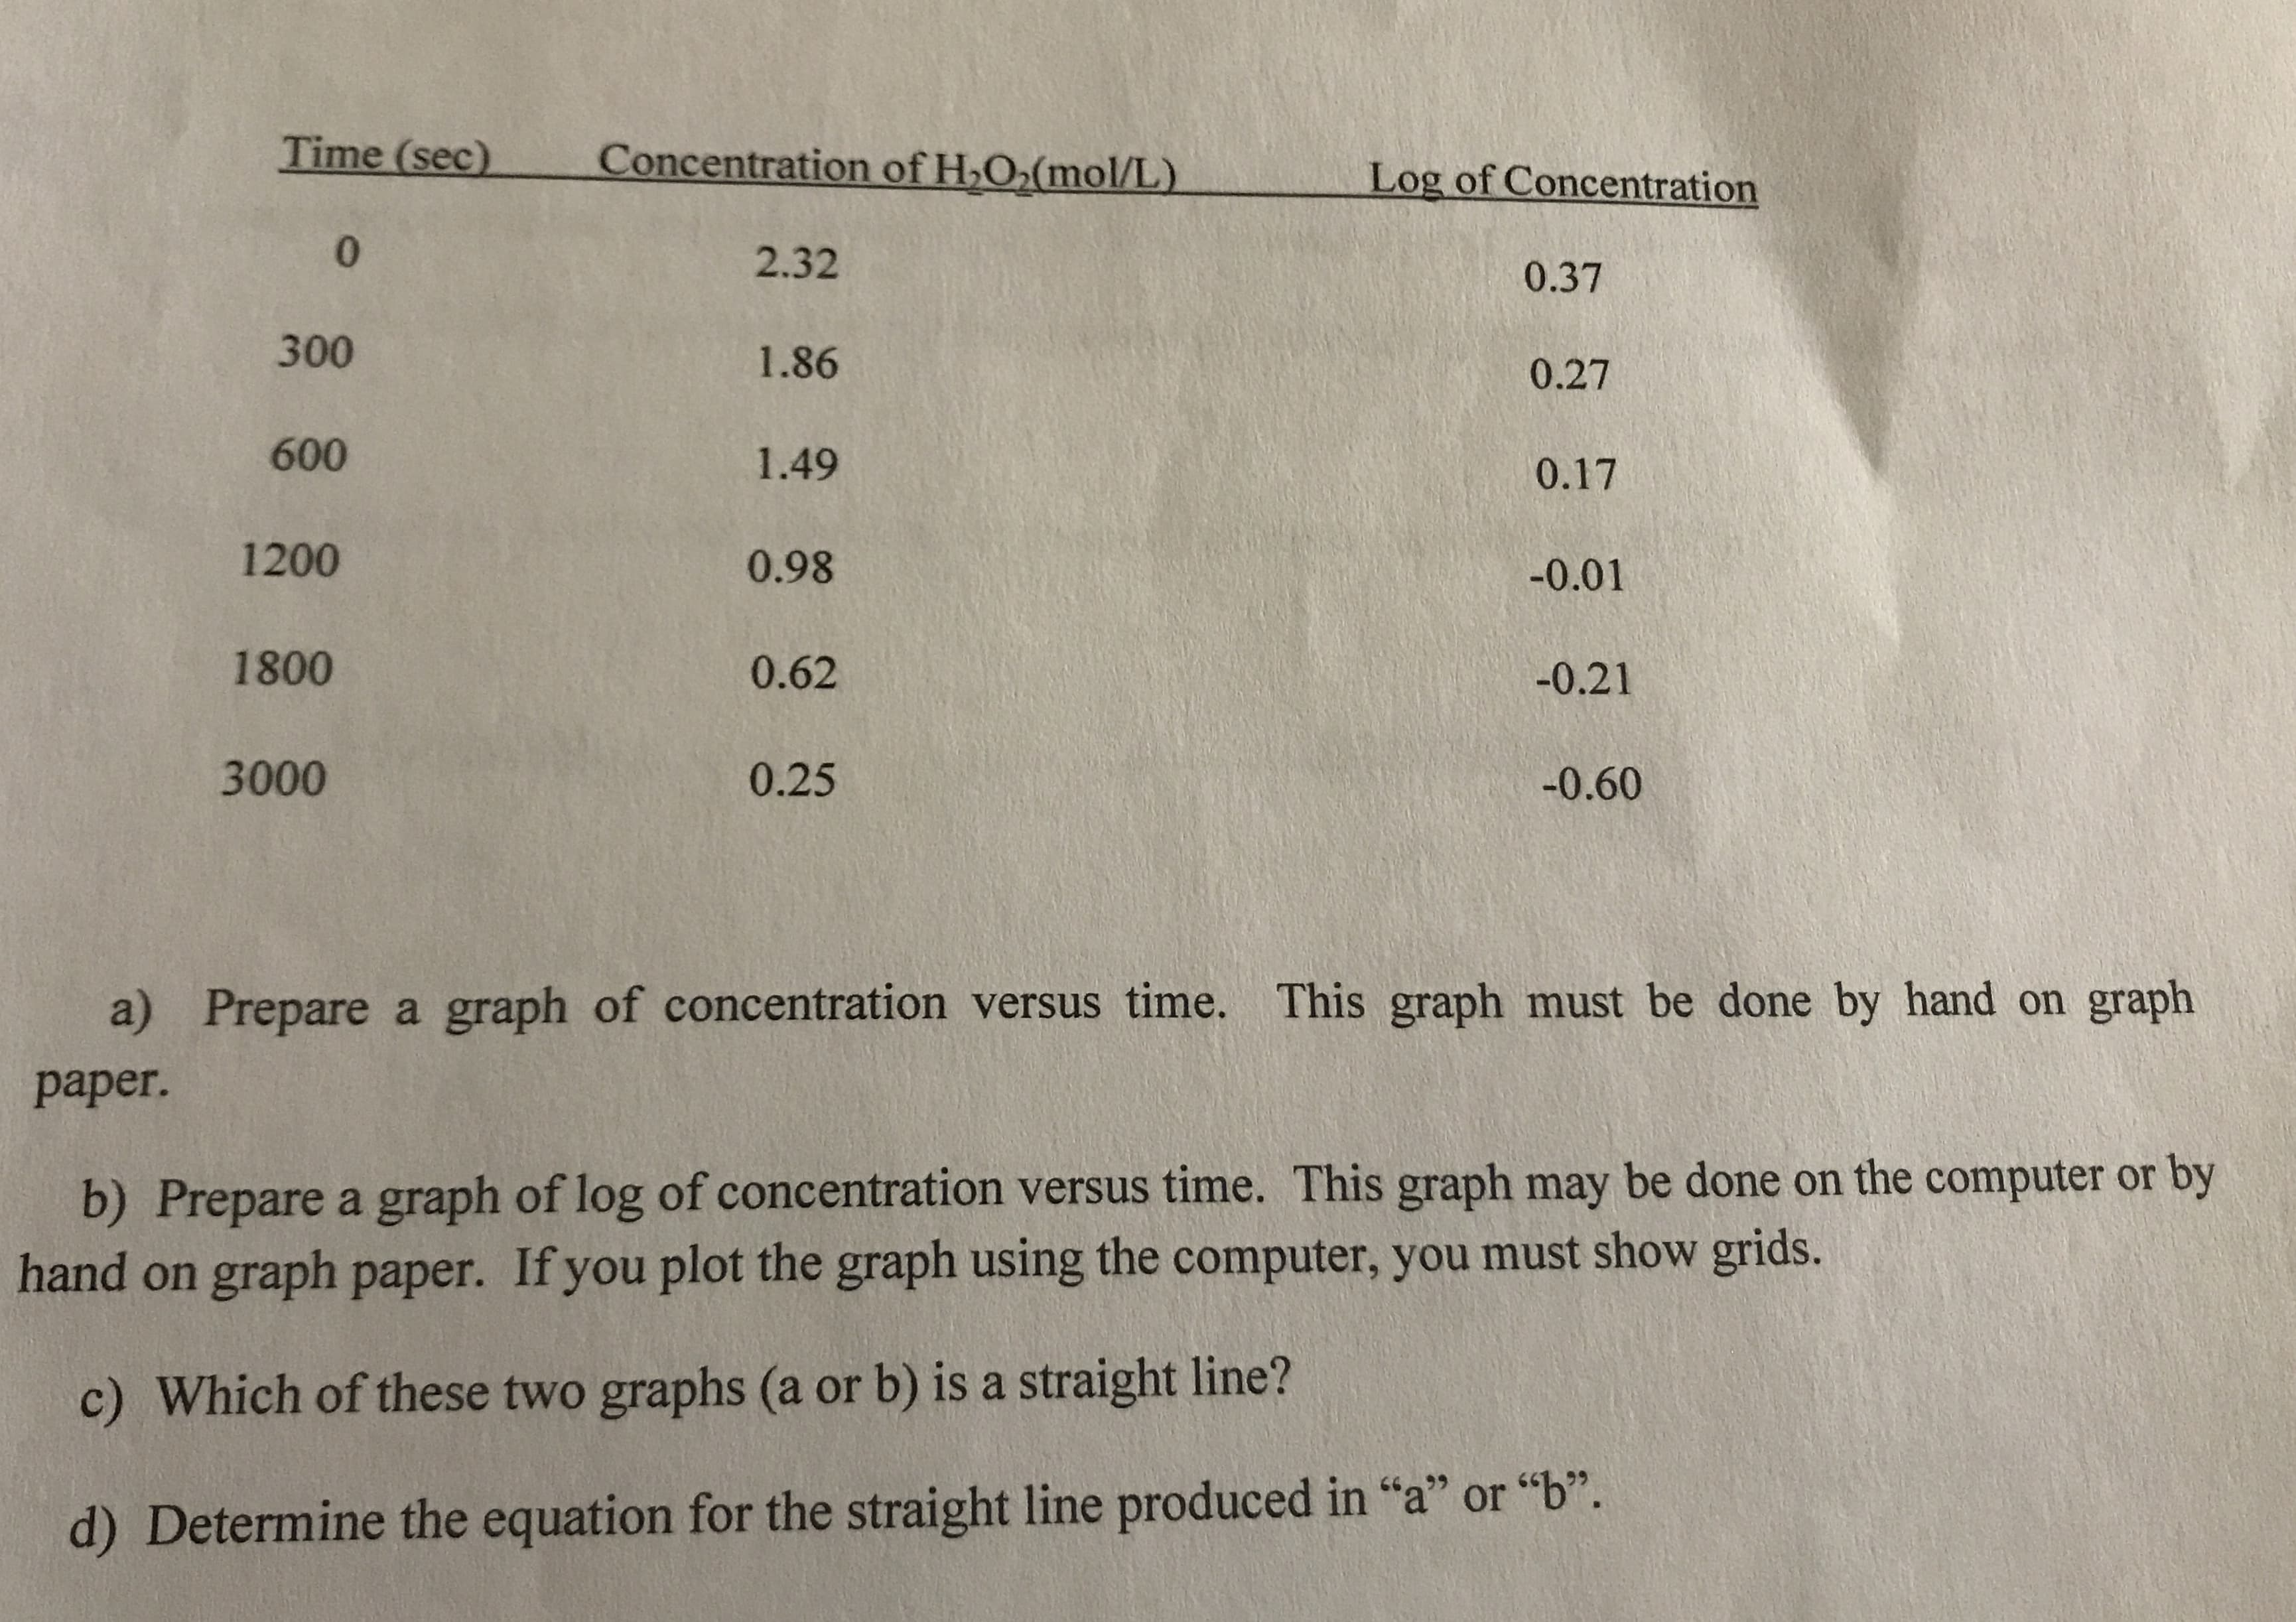
Transcribed Image Text:Time (sec)
Concentration of H,O2(mol/L)
Log of Concentration
0
2.32
0.37
300
1.86
0.27
600
1.49
0.17
1200
0.98
-0.01
1800
0.62
-0.21
3000
0.25
-0.60
a) Prepare a graph of concentration versus time. This graph must be done by hand on graph
рaper.
b) Prepare a graph of log of concentration versus time. This graph may be done on the computer or by
hand on graph paper. If you plot the graph using the computer, you must show grids.
c) Which of these two graphs (a or b) is a straight line?
d) Determine the equation for the straight line produced in "a" or "b".
Expert Solution
This question has been solved!
Explore an expertly crafted, step-by-step solution for a thorough understanding of key concepts.

This is a popular solution!

Trending now
This is a popular solution!

Step by step
Solved in 4 steps with 2 images

Recommended textbooks for you
Chemistry by OpenStax (2015-05-04)
Chemistry
ISBN:
9781938168390
Author:
Klaus Theopold, Richard H Langley, Paul Flowers, William R. Robinson, Mark Blaser
Publisher:
OpenStax

General Chemistry - Standalone book (MindTap Cour…
Chemistry
ISBN:
9781305580343
Author:
Steven D. Gammon, Ebbing, Darrell Ebbing, Steven D., Darrell; Gammon, Darrell Ebbing; Steven D. Gammon, Darrell D.; Gammon, Ebbing; Steven D. Gammon; Darrell
Publisher:
Cengage Learning

Chemistry: Principles and Reactions
Chemistry
ISBN:
9781305079373
Author:
William L. Masterton, Cecile N. Hurley
Publisher:
Cengage Learning
Chemistry by OpenStax (2015-05-04)
Chemistry
ISBN:
9781938168390
Author:
Klaus Theopold, Richard H Langley, Paul Flowers, William R. Robinson, Mark Blaser
Publisher:
OpenStax
General Chemistry - Standalone book (MindTap Cour…
Chemistry
ISBN:
9781305580343
Author:
Steven D. Gammon, Ebbing, Darrell Ebbing, Steven D., Darrell; Gammon, Darrell Ebbing; Steven D. Gammon, Darrell D.; Gammon, Ebbing; Steven D. Gammon; Darrell
Publisher:
Cengage Learning
Chemistry: Principles and Reactions
Chemistry
ISBN:
9781305079373
Author:
William L. Masterton, Cecile N. Hurley
Publisher:
Cengage Learning

Chemistry: The Molecular Science
Chemistry
ISBN:
9781285199047
Author:
John W. Moore, Conrad L. Stanitski
Publisher:
Cengage Learning

Chemistry: Principles and Practice
Chemistry
ISBN:
9780534420123
Author:
Daniel L. Reger, Scott R. Goode, David W. Ball, Edward Mercer
Publisher:
Cengage Learning

Chemistry & Chemical Reactivity
Chemistry
ISBN:
9781133949640
Author:
John C. Kotz, Paul M. Treichel, John Townsend, David Treichel
Publisher:
Cengage Learning