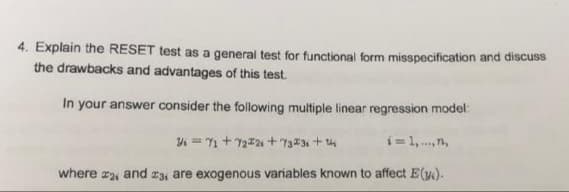
4. Explain the RESET test as a general test for functional form misspecification and discuss the drawbacks and advantages of this test. In your answer consider the following multiple linear regression model: i=1, .,n,


Q: An upward sloping linear trend line through a scatter plot indicates a a) postive mean b) nega...
A: An upward sloping linear trend line through a scatter plot indicates a
Q: A small-business Web site contains 100 pages and 60%, 30%, and 10% of the pages contain low, moderat...
A:
Q: There is a double log function, what will "a" and "b" equal if the function is a line with a slope o...
A: Explanation:Here given the log function a and b if the function line with a slope of 2 For this exp...
Q: 2. In the numbers {1, 3, 5, 7, 9} construct the following: a. List of possible sample size of 3 that...
A: The possible samples that can be formed from the {1,3,5,7,9} of size 3 are given as below: 3 5 7...
Q: 20%of patients in a clinic have Covid-19. 10 percent of the clinic’s patients are diabetics. Amongs...
A:
Q: Suppose Z is a random variable that follows the standard normal distribution. d) Find z0.06. e) Find...
A:
Q: disease occurs in 1% of the population. A diagnostic test gives a positive result in: 99% of people ...
A: Find P(disease/ positive) = ?
Q: The number of megapixels in a digital camera is one of the most important factors in determining pic...
A: For the given data Standard error of estimate = ?
Q: 8. a quantile regression where cumulative abnormal returns are regressed on earnings surprises, if ...
A:
Q: 2.3.1 What probability distribution function(s) can be used to calculate probability of successfully...
A: 2.3.1 Here we want to determine the distribution of number of trials required to find oil for the ve...
Q: A fair coin is tossed many times. A scatter plot is created showing the total number of tosses versu...
A: The objective, in this case, is to interpret if any possible correlation between the variables "numb...
Q: A box contains 10 balls. Three are numbered 0, two are numbered 1, one is numbered 2, two are number...
A:
Q: Previous Problem Problem List Next Problem An algebra class has 8 students and 8 desks. For the sake...
A: Given that
Q: + 1 2 3 4 P(x) 0.321 0.345 0.156 0.063 0.115 (a) Verify that this is a discrete probability distribu...
A: Given that The probability distribution table X 0 1 2 3 4 P(x) 0.321 0.345 0.156 0.063 0.115 ...
Q: (a) Suppose you are given the following (x, y) data pairs. 1 6 y 4 3 9 n USE SALT Find the least-squ...
A: “Since you have posted a question with multiple sub-parts, we will solve first three subparts for yo...
Q: Suppose we have a deck of cards, but some of the cards are missing. That is, instead of 52 cards, we...
A: Given that, deck of contains 48 cards. Two friends play magic trick in which one select card from de...
Q: A distribution of values is normal with a mean of 50 and a standard deviation of 25. From this distr...
A: GivenMean(μ)=50standard deviation(σ)=25sample size(n)=31
Q: A company produces steel rods. The lengths of the steel rods are normally distributed with a mean of...
A:
Q: Statement: The sum of n independent Gammä variates is also a Gamma variate. i.e., If x„X,....., X, a...
A:
Q: The overall differences between treatments is represented by the _________.
A: ANOVA is Analysis of Variance.
Q: 7) A jar contains 7 red marbles, 7 yellow marbles, 4 green marbles, and 3 blue marbles. a) If drawin...
A: Number of red marbles (r) = 7 Number of yellow marbles (y) = 7 Number of green marbles (g) = 4 Numbe...
Q: Test the hypothesis that mean is less than 1500. Use the 1% level of significance. Would your conclu...
A: Given: Scores, X 1561 1554 1536 1531 1523 1518 1515 1511 1506 1500 1499 1...
Q: 2. [Chemotheraphy] A cancer specialist believes that the 5-year survival rate of certain cancer pati...
A:
Q: n the study cited in Exercise 5.3.4, researchers found the mean sodium intake in men and women 60 ye...
A: Since you have posted multiple sub-parts of question , we will solve first three sub-parts of questi...
Q: Determine the probability density function for the following cumulative distribution function. F(x) ...
A: Given,F(X)=1-e-2x ; x>0
Q: A statistics student wants to conduct a study to determine the proportion of workers in Cititon who ...
A:
Q: Assume X is normally distributed with a mean of 10 and a standard deviation of 2. Determine the foll...
A:
Q: An analysis of variances produces dftotal = 16 and dfwithin = 14. For this analysis, how many treatm...
A:
Q: According to a study conducted by a statistical organization, the proportion of people who are sati...
A:
Q: In Alpha College, students are required to join at least one school club to get extra-curriculum act...
A: Probability : Probability merely refers to however doubtless one thing is to occur. once we are unsu...
Q: Which of the following is a correct interpretation for P(x < 16)? O a. determine a probability that ...
A: Given
Q: 3. Fit a straight line trend using the method of least squares and estimate the profits for the year...
A:
Q: B. Directions: Solve the corresponding z-score for each raw score. Indicate also whether each raw sc...
A:
Q: Calculate the t-statistic for each of the following
A: The objective is to calculate t statistic
Q: The following data represent the number of games played in each series of an annual tournament from ...
A:
Q: wing probablity distribution, the random variable x represents the number of activities a pare ade s...
A: This is a discrete probability distribution because the sum of the probabilities is ? and each proba...
Q: 1. A researcher is interested in knowing if there is a sigh performance of grade 4 students in entra...
A:
Q: a. Find the probability of a student taking Math and Sophomore. b. Find the probability of a student...
A:
Q: There are 15,958,866 adults in a region. If a polling organization randomly selects 1235 adults with...
A:
Q: i) If U, and U2 each have a normal distribution with mean 0 and variance 20². Furthermore, mu, (t) =...
A: Given that, U1 and U2 are two random variables follow normal distribution with mean 0 and variance 2...
Q: For a population with mean of 50 and standard deviation of 8, what is the raw score that corresponds...
A: We have given that mean = μ = 50standard deviation = σ = 8 z = 0.25
Q: 7Example 14. From the data given below estimate the most likely height of a brother whose sister 's ...
A:
Q: he Asian longhorned beetle kills trees by burrowing within the trunk and branches and disrupting the...
A: The provided image is:
Q: he weight of 10 boxes of a certain brand of cereal have a mean content of 278 grams with a standard ...
A: Given : Sample size of boxes = 10 w : Weight p : Price Mean (X¯w)=278S.D (Sw)=9.64Mean (X¯p)=1.29S.D...
Q: 5. We have two events, A and B. P(A) = 1/2 and P(B) = 1/3. Hint: Draw Venn diagrams to help you thin...
A:
Q: If covariance between X and Y variables is 10 and the variances of X and Y are respectively 16 and 9...
A: The objective is to find correlation coefficient
Q: Example 11. Find the mean values of two random variables x and y and the correlation pefficient betw...
A:
Q: The juror pool for an upcoming trial contains 100,000 individuals in the population who may be calle...
A: Given : The juror pool for an upcoming trial contains 100000 no. of individuals in the population wh...
Q: (c) Calculate a 90% lower confidence bound for o. i 1.23
A: Here calculate sample variance from given
Q: If the z-value is within the critical region, what should be done with the hypothesis?
A: Rejection rule:1) if the test statistic value fall outside critical regionthen we fail to reject th...

Step by step
Solved in 3 steps

- The following fictitious table shows kryptonite price, in dollar per gram, t years after 2006. t= Years since 2006 0 1 2 3 4 5 6 7 8 9 10 K= Price 56 51 50 55 58 52 45 43 44 48 51 Make a quartic model of these data. Round the regression parameters to two decimal places.Olympic Pole Vault The graph in Figure 7 indicates that in recent years the winning Olympic men’s pole vault height has fallen below the value predicted by the regression line in Example 2. This might have occurred because when the pole vault was a new event there was much room for improvement in vaulters’ performances, whereas now even the best training can produce only incremental advances. Let’s see whether concentrating on more recent results gives a better predictor of future records. (a) Use the data in Table 2 (page 176) to complete the table of winning pole vault heights shown in the margin. (Note that we are using x=0 to correspond to the year 1972, where this restricted data set begins.) (b) Find the regression line for the data in part ‚(a). (c) Plot the data and the regression line on the same axes. Does the regression line seem to provide a good model for the data? (d) What does the regression line predict as the winning pole vault height for the 2012 Olympics? Compare this predicted value to the actual 2012 winning height of 5.97 m, as described on page 177. Has this new regression line provided a better prediction than the line in Example 2?The table below shows the number of state-registered automatic weapons and the murder rate for several Northwestern states, where xx is thousands of automatic weapons and yy is murders per 100,000 residents. xx 11.3 8.2 7.1 3.7 2.9 2.2 2.1 0.6 yy 13.9 10.7 10.3 7.2 6.5 5.6 5.5 4.6 Use your calculator to determine the equation of the regression line and write it in the y=ax+by=ax+b form. Round to 2 decimal places. According to this model, how many murders per 100,000 residents can be expected in a state with 4.6 thousand automatic weapons? Round to 3 decimal places. According to this model, how many murders per 100,000 residents can be expected in a state with 4.4 thousand automatic weapons? Round to 3 decimal places.
- Consider the following population linear regression model of individual food expenditure: Y = 50 + 0.5X + u, where Y is weekly food expenditure in dollars, X is the individual’s age, and 50+0.5X is the population regression line. Suppose we generate artificial data for 3 individuals using this model. This artificial sample, which consists of 3 observations, is shown in the following table: Answer the following questions. Show your working. (a) What are the values of V1 and V4? (b) Suppose we know that in this artificial sample, the sample covariance between X and Y is 150, and the sample variance of X is 100. Compute the OLS regression line of the regression of Y on X. (Hint: Assume these summary statistics and the OLS regression line continue to hold in parts (c)-(e).) (c) What are the values of V5 and V7?I have some doubts regarding linear regression. if any 2 variables in X1, X2 AND Y have a positive correlation, then in the linear regression Y = b0 + b1X1 +b2X2 +e, will the sign of b1 and b2 both be positive? will the residuals that we get from linear regression will always be uncorrelated given X?he following table shows the annual number of PhD graduates in a country in various fields. NaturalSciences Engineering SocialSciences Education 1990 70 10 60 30 1995 130 40 100 50 2000 330 130 280 140 2005 490 370 460 210 2010 590 550 830 520 2012 690 590 1,000 900 (a)With x = the number of social science doctorates and y = the number of education doctorates, use technology to obtain the regression equation. (Round coefficients to three significant digits.) y(x) = Use technology to obtain the coefficient of correlation r. (Round your answer to three decimal places.) r =
- Suppose a study wants to predict the market price of a certain species of turtle (Y) based on the following independent variables indicated in the table. Based from the table, what is the equation of the multiple linear regression? (Round off up to two decimal places. Market Price = 0.07 - 0.40*weight + 1.51*length + 1.41*width + 0.80*age Market Price = - 0.40*weight + 1.51*length + 1.41*width + 0.80*age Market Price = 0.07 + 0.40*weight + 1.51*length + 1.41*width + 0.80*age Market Price = 0.07 - 0.40 + weight + 1.51 + length + 1.41 + width + 0.80 + ageSuppose we want to predict job performance of mechanics based on mechanical aptitude test scores and test scores from personality test that measures conscientiousness. (a) Determine the regression equation. (b) Determine the SSE. Y X1 X2 1 40 25 2 45 20 1 38 30 3 50 30 2 48 28 3 55 30 3 53 34 4 55 36 4 58 32 3 40 34 5 55 38 3 48 28 3 45 30 2 55 36 4 60 34 5 60 38 5 60 42 5 65 38 4 50 34 3 58 38 Where Y is the Performance of the mechanics, X1 is the mechanical aptitude test and X2 is the personality test score that measure conscientiousness.The table below shows the number of state-registered automatic weapons and the murder rate for several Northwestern states. xx 11.7 8.4 6.6 3.9 2.4 2.4 2.2 0.6 yy 14 10.9 9.4 7.5 6 5.8 5.8 4.4 xx = thousands of automatic weaponsyy = murders per 100,000 residents Use excel to determine the equation of the regression line. (Round to 2 decimal places)Determine the regression equation in y = b0 + bx(x) form and write it below. A) How many murders per 100,000 residents can be expected in a state with 10.7 thousand automatic weapons? B) How many murders per 100,000 residents can be expected in a state with 2.1 thousand automatic weapons?
- The following table shows the annual number of PhD graduates in a country in various fields. NaturalSciences Engineering SocialSciences Education 1990 70 10 70 30 1995 130 40 110 40 2000 330 130 280 120 2005 490 370 460 210 2010 590 550 830 520 2012 690 590 1,000 900 (a) With x = the number of social science doctorates and y = the number of education doctorates, use technology to obtain the regression equation. (Round coefficients to three significant digits.) y(x) = (b) Use technology to obtain the coefficient of correlation r. (Round your answer to three decimal places.) r =A sixth-grade teacher believes that there is a relationship between his students’ IQscores (y) and the numbers of hours (x) they spend watching television each week. Thefollowing table shows a random sample of 7 sixth-grade students.y 125 116 97 114 85 107 105x 5 10 30 16 41 28 21 Does the data provide sufficient evidence to indicate that the simple linear regressionmodel is appropriate to describe the relationship between x and y? Perform a model utilitytest at α = 0.05. (Give H0, Ha, rejection region, observed test statistic, P-value, decisionand conclusion.)Find the Pearson sample correlation coefficient between x and y. Then interpretthe result.Suppose that researchers are interested in determining the bi-annual salary of statisticians of different levels using their years of experience and their education level (M = bachelors, P = doctorate). They fit the following model to a dataset that includes these variables and, after performing the proper steps of multiple linear regression, the following multiple linear regression model is obtained: yˆ = 42308 + 323x1 + 213x2 + 301(x1*x2) where the variables are as follows: yˆ = predicted bi−annual salary in dollars, x1 = number of years of experiencex2= {1 if the education level is a doctorate 0 if the education level is a bachelors What is the predicted bi-annual salary in dollars of an employee with 5 years of experience and a bachelor’s degree?

