4. Fit a straight line to the following data and compute the standard deviation. 10 ter 0.5 1 1.5 2.5 3. 3.076 2.810 2.588 2.297 1.981 1.912 1.653 3.5 4 4.5 1.478 1.399 1.018 0.794
4. Fit a straight line to the following data and compute the standard deviation. 10 ter 0.5 1 1.5 2.5 3. 3.076 2.810 2.588 2.297 1.981 1.912 1.653 3.5 4 4.5 1.478 1.399 1.018 0.794

Glencoe Algebra 1, Student Edition, 9780079039897, 0079039898, 2018
18th Edition
ISBN:9780079039897
Author:Carter
Publisher:Carter
Chapter10: Statistics
Section10.3: Measures Of Spread
Problem 23PFA

Related questions
Question
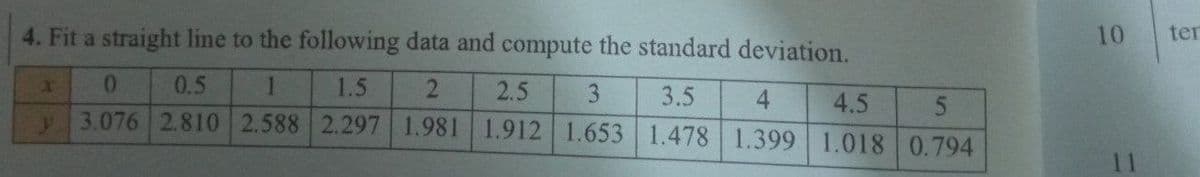
Transcribed Image Text:4. Fit a straight line to the following data and compute the standard deviation.
10
ter
0.5
1.5
2.5
3.076 2.810 2.588 2.297 1.981 1.912 1.653 1.478 1.399 1.018 0.794
3
3.5
4
4.5
Expert Solution
This question has been solved!
Explore an expertly crafted, step-by-step solution for a thorough understanding of key concepts.

Step by step
Solved in 2 steps with 2 images

Recommended textbooks for you
Glencoe Algebra 1, Student Edition, 9780079039897…
Algebra
ISBN:
9780079039897
Author:
Carter
Publisher:
McGraw Hill
Glencoe Algebra 1, Student Edition, 9780079039897…
Algebra
ISBN:
9780079039897
Author:
Carter
Publisher:
McGraw Hill