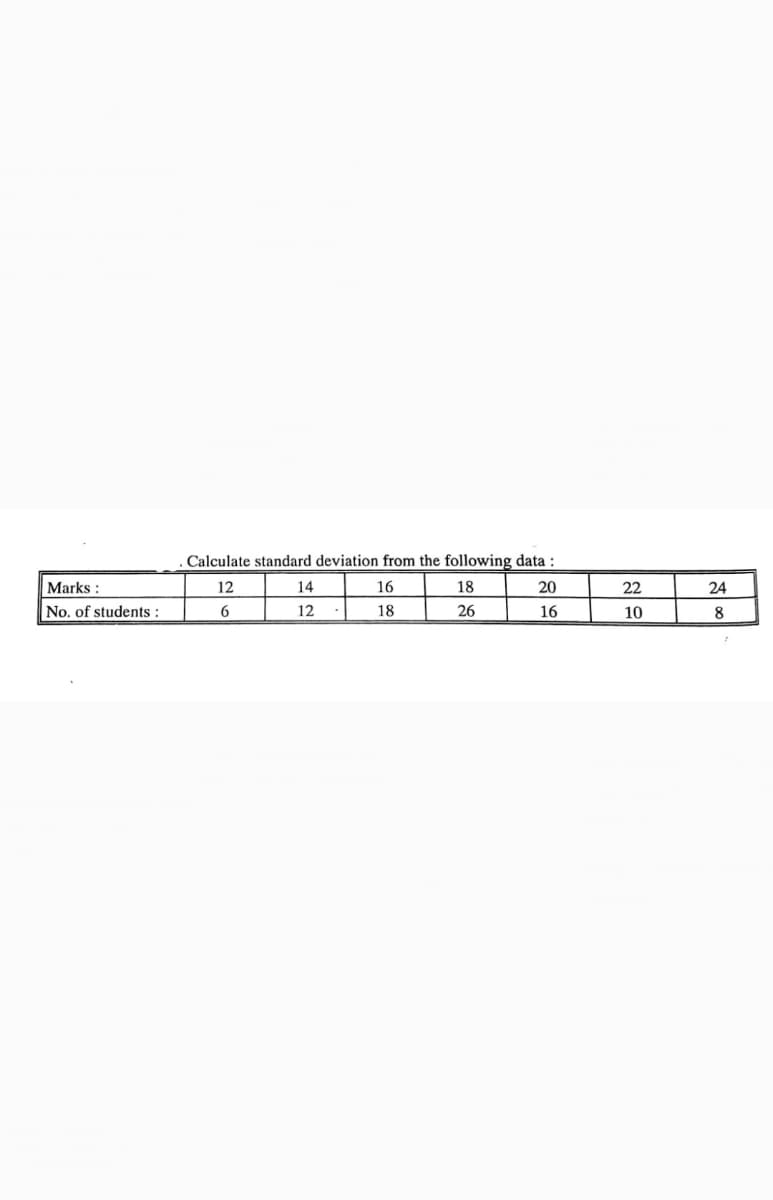
. Calculate standard deviation from the following data : Marks: 12 14 16 18 20 22 24 No. of students : 12 18 26 16 10 8


Q: Calculate the standard deviation from the data given below : Size of item Frequency Size of item…
A:
Q: From the following data compute Quartile Deviation : Size : 4- 7 8-10 11-13 14-16 17-19 Frequency 14…
A:
Q: For the following data set, approximate the sample standard deviation frequency table shows phone…
A:
Q: 3. Find out the value of quartile deviation and its coefficient from the follev dadi. Roll No. 1 4…
A:
Q: Calculate the standard deviation from the data given below : Size of item Frequency Size of item…
A:
Q: Find the range, variance and standard deviation of the following grouped data. 2. The following data…
A:
Q: Compute Quartile Deviation of the following data: Wages 100 140 180 200 240 300 320 Workers 10 16 14…
A: Given data is Wages 100 140 180 200 240 300 320 Workers 5 7 10 16 14 8 4
Q: 6. The following data is given: Average Domestic animals Number of Types of Animals Standard…
A:
Q: For the following data set, approximate the sample standard deviation to the nearest hundreth using…
A: Mid -point =lower limit + upper limit2Mid point of first class =50+522=51Similarly for other…
Q: Calculate Coefficient of Concurrent Deviation from the following data: X: 1 2 3 5 6. y: 25 16 5 1
A: Solution:
Q: Calculate standard deviation from the following data. Marks Frequency | 6 0-10 10-20 20-30 30-40…
A: Class Interval Frequency, f Midpoint, x fx x2 fx2 0-10 6 5 30 25 150 10-20 8 15 120 225 1800…
Q: For the following data set, approximate the sample standard deviation of emails per day, rounding to…
A: Solution:
Q: Calculate the sample standard deviation of the data shown. Round to two decimal places. X 22 17 29…
A: The random variable X follows normal distribution. We have to find the sample standard deviation.
Q: Calculate the coefficient of variation t
A: Our aim is to find the coefficient of variation. From the given data : n=5 , ƩX=140 , ƩX2=4038
Q: Consider the following set of test scores for James and Rob in Chemistry. James 62 80 83 72 73 Rob…
A:
Q: Consider the following sample: 10 12 14 20 31 35 40 40 55 55 57 63…
A: Solution: From the given information, the mean is 47.1250 and standard deviation is 26.1938.
Q: -32. Calculate Coefficient of Concurrent Deviations from the data given below : No. of Workers: 300…
A:
Q: A bakery ownertabulated sales to 50 customers and obtained the distribution. Find the mean and…
A: Mean: The mean is the sum of observations divided by number of observations. that is, Mean = x =…
Q: 1b) Calculate the mean deviation from the mean for the following data: Size : 4 8. 10 12 14 16…
A: We have given that, Date set in the form of size and frequency is, Xi = 2 4 6 8 10…
Q: For the following data set, approximate the sample standard deviation of distances from O A. 4.9…
A: It is an important part of statistics. It is widely used.
Q: d the mean, variance and standard deviation of the following data: X 19 20 21 22 23 P(X) 0.2 0.2 0.3…
A: From the given information we find the solution.
Q: Calculate standard deviation and its coefficient of variation from the following data : Measurements…
A: Class Frequency (f) Mid value (x) f⋅x f⋅x2 0-5 4 2.5 10 25 5-10 1 7.5 7.5 56.25 10-15 10…
Q: 4. Compute coefficient of quartile deviation from the following data : Marks 10 20 30 40 No. of…
A:
Q: Find the standard deviation for the grouped data. College Units Frequency 0-24 4 25-49 3 50-74 6…
A: Here we use simple method which is used to find deviation
Q: Using the given data (population) below, compute the following statistics: 47 72…
A:
Q: Calculate Standard deviation of the following data. No. of Employees : 10-19 20-29 50-59 3. 30-39…
A: Create a table with column labels Class interval, frequency (f), midpoint (x), fx, and fx2.…
Q: Calculate Standard deviation of the following data : No. of Employees : 10-19 20-29 30-39 40-49…
A: Given: No. of employees No of firms 10-19 6 20-29 11 30-39 14 40-49 6 50-59 3
Q: Find the range, variance and standard deviation of the following grouped data. 2. The following data…
A: Solution: The frequency distribution table is Rainfall ( inches ) Class Boundary Number of…
Q: Calculate standard deviation for the following distribution: Values: 10 20 30 40 50 60 70 Frequency:…
A: Formula for sample standard deviation of grouped data : s =∑x2f -∑xf2∑f∑f-1
Q: Find Standard Deviation for the following frequency distribution 10 11 12 13 14 Total 3 12 18 12 48
A:
Q: Given the following data set: 24; 32; 27; 22; 35; 18; 29; 25; 22. Calculate the coefficient of…
A: Concept: Coefficient of variation (CV)=(Mean/standard deviation)*100
Q: Calculate the standard deviation from the following data : Size of item Frequency Size of item…
A:
Q: A Calculate the mean deviation and its coefficient from the following data: Class AnFrequency…
A: Here, N= 92 , let A = 45 , class size (h) = 10 Mid value (x) = (lower class - upper class)…
Q: Calculate Quartile Deviation and coefficient of Quartile Deviation from the following data : Age in…
A:
Q: Compute cocfficient of quartile deviation from the following data: 50 Marks 10 40 80 30 15 20 No. of…
A: Given The data is as follows: Marks No. of students 10 4 20 7 30 15 40 8 50 7 80 2
Q: A bakery owner tabulated sales to 50 customers and obtained the distribution. Find the mean and…
A: The table is given as: Class Continuous class Class markxi Frequencyfi fixi fixi2 0.00-1.99…
Q: Which is the largest with regard to the following data set: the range or the standard deviation? 11…
A: We have given that, X :- 11, 11, 12, 12, 12, 12, 13, 15, 17, 22, 22, 22 Then, We will check which…
Q: = 26 : Calculate Standard deviation of the following data. No. of Employees : 10-19 No. of firms…
A: Here given grouped data with frequency From given table calculation is on further step
Q: A series of sodium chloride samples are analyzed and the following results were recorded: Sample…
A: In Statistics, deviation is a measure of difference between the observed value of a variable and…
Q: a) Calculate the Median, Mode and standard deviation of the following data 71 Weights 63 65 66 67 68…
A: Let xi be the value and fi be the frequency associated with value xi . Weights (xi) 63 64 65 66…
Q: This question refer to the following data: Sentence Year. 13 10 8 6 4 7 14 7 What is the standard…
A: Given data, 13,10,8,6,4,7,14,9,7 Standard deviation=? Mean is =∑xn=789=8.67
Q: Calculate Quartile Deviation and its Coefficient from the following data : Weight (in pounds) 120…
A:
Q: aisgin, Calculate Quartile Deviation and its Coefficient from the following data : Weight (in…
A:
Q: A series of sodium chloride samples are analyzed and the following results were recorded: Sample…
A: The provided data set is:
Q: Calculate Quartile Deviation and its Coefficient from the following data : Weight (in pounds) 120…
A:
Q: 6. The following data is given: Number of animals 15 5 5 Average Domestic animals 2 Types of Animals…
A: Types of Animal n x s s2 Dogs 5 2 1 1 Cats 5 3 1.87 3.4969 Hamster 5 4 1.41 1.9881 p = 3 n…
Q: Compute coefficient of quartile deviation from the following data : Marks 10 20 30 40 50 60 No. of…
A:
Q: Find the median and meản deviation of the following data : Size Frequency Şize Frequency 0-10 7…
A:
Q: Use the following Frequency table to calculate the standerd deviation. Class Frequency…
A: Here, Class Interval Frequency, f Midpoint, x fx x2 fx2 2-4 4 3 12 9 36 5-7 6 6 36 36 216…
Q: calculate the standard deviation for the data in the table Range Frequency 1-10 11-20 7. 21-30 10…
A: We have to find the standard deviation.


Trending now
This is a popular solution!

Step by step
Solved in 2 steps with 2 images
