4. Fuel costs are important to profitability in the airline business. A small regional carrier has been operating three types of aircraft and has collected the following cost data from its 14 planes, expressed as fuel cost (in hundred pesos) per available seat kilometer: Турe A : 73 82 76 68 80 79 Туре В : 56 76 72 79 82 69 Туре С : 79 95 87 83 94 84 At the 0.01 level of significance, can we conclude that there is no true difference between plane types in fuel costs?
4. Fuel costs are important to profitability in the airline business. A small regional carrier has been operating three types of aircraft and has collected the following cost data from its 14 planes, expressed as fuel cost (in hundred pesos) per available seat kilometer: Турe A : 73 82 76 68 80 79 Туре В : 56 76 72 79 82 69 Туре С : 79 95 87 83 94 84 At the 0.01 level of significance, can we conclude that there is no true difference between plane types in fuel costs?

Glencoe Algebra 1, Student Edition, 9780079039897, 0079039898, 2018
18th Edition
ISBN:9780079039897
Author:Carter
Publisher:Carter
Chapter10: Statistics
Section10.6: Summarizing Categorical Data
Problem 25PPS

Related questions
Question
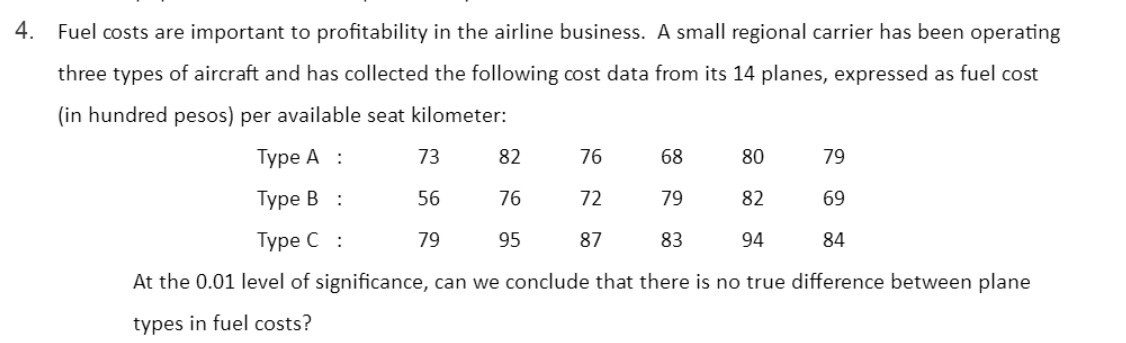
Transcribed Image Text:4. Fuel costs are important to profitability in the airline business. A small regional carrier has been operating
three types of aircraft and has collected the following cost data from its 14 planes, expressed as fuel cost
(in hundred pesos) per available seat kilometer:
Туре А :
73
82
76
68
80
79
Туре В :
56
76
72
79
82
69
Туре С :
79
95
87
83
94
84
At the 0.01 level of significance, can we conclude that there is no true difference between plane
types in fuel costs?
Expert Solution
This question has been solved!
Explore an expertly crafted, step-by-step solution for a thorough understanding of key concepts.

Step by step
Solved in 2 steps with 1 images

Recommended textbooks for you
Glencoe Algebra 1, Student Edition, 9780079039897…
Algebra
ISBN:
9780079039897
Author:
Carter
Publisher:
McGraw Hill

Holt Mcdougal Larson Pre-algebra: Student Edition…
Algebra
ISBN:
9780547587776
Author:
HOLT MCDOUGAL
Publisher:
HOLT MCDOUGAL

Glencoe Algebra 1, Student Edition, 9780079039897…
Algebra
ISBN:
9780079039897
Author:
Carter
Publisher:
McGraw Hill
Holt Mcdougal Larson Pre-algebra: Student Edition…
Algebra
ISBN:
9780547587776
Author:
HOLT MCDOUGAL
Publisher:
HOLT MCDOUGAL