Five hundred children participaied in a field demonstration. Their heights average 110 cm with a standard deviation of 6 cm. a) Sketch the normal curve of the given situation. b) What is the probability that a child picked at random has a height greater than 116 cm? c) What is the probability that the height of a child picked at random is less than 104 cm?
Five hundred children participaied in a field demonstration. Their heights average 110 cm with a standard deviation of 6 cm. a) Sketch the normal curve of the given situation. b) What is the probability that a child picked at random has a height greater than 116 cm? c) What is the probability that the height of a child picked at random is less than 104 cm?

MATLAB: An Introduction with Applications
6th Edition
ISBN:9781119256830
Author:Amos Gilat
Publisher:Amos Gilat
Chapter1: Starting With Matlab
Section: Chapter Questions
Problem 1P

Related questions
Question
Problem #2
Transcribed Image Text:Problem #1 (
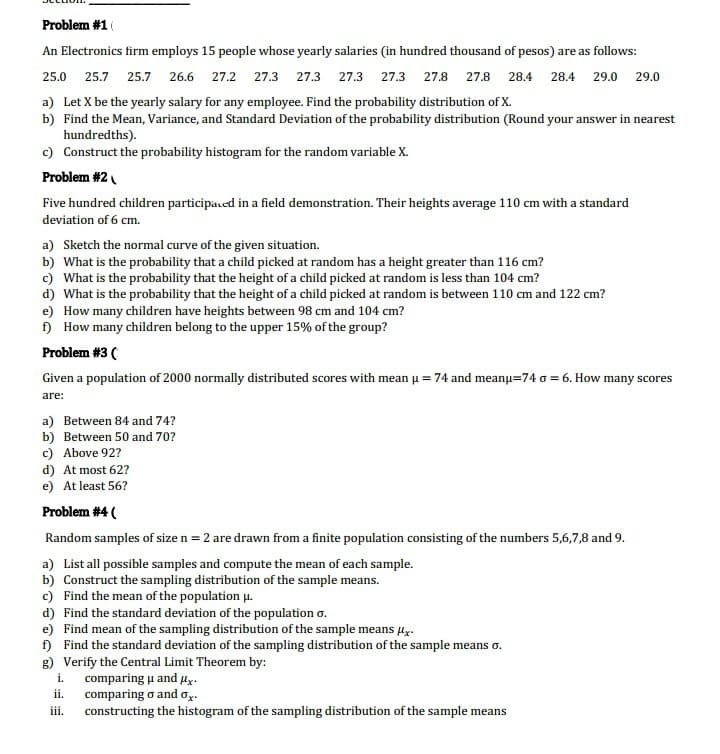
An Electronics firm employs 15 people whose yearly salaries (in hundred thousand of pesos) are as follows:
25.0 25.7 25.7
26.6 27.2 27.3 27.3 27.3 27.3 27.8 27.8 28.4 28.4 29.0 29.0
a) Let X be the yearly salary for any employee. Find the probability distribution of X.
b) Find the Mean, Variance, and Standard Deviation of the probability distribution (Round your answer in nearest
hundredths).
c) Construct the probability histogram for the random variable X.
Problem #2
Five hundred children participaed in a field demonstration. Their heights average 110 cm with a standard
deviation of 6 cm.
a) Sketch the normal curve of the given situation.
b) What is the probability that a child picked at random has a height greater than 116 cm?
c) What is the probability that the height of a child picked at random is less than 104 cm?
d) What is the probability that the height of a child picked at random is between 110 cm and 122 cm?
e) How many children have heights between 98 cm and 104 cm?
) How many children belong to the upper 15% of the group?
Problem #3 (
Given a population of 2000 normally distributed scores with mean u = 74 and meanu=74 o = 6. How many scores
are:
a) Between 84 and 74?
b) Between 50 and 70?
c) Above 92?
d) At most 62?
e) At least 56?
Problem #4 (
Random samples of size n = 2 are drawn from a finite population consisting of the numbers 5,6,7,8 and 9.
a) List all possible samples and compute the mean of each sample.
b) Construct the sampling distribution of the sample means.
c) Find the mean of the population u.
d) Find the standard deviation of the population o.
e) Find mean of the sampling distribution of the sample means 4y.
f) Find the standard deviation of the sampling distribution of the sample means o.
g) Verify the Central Limit Theorem by:
i.
ii.
comparing u and Hx.
comparing o and og.
constructing the histogram of the sampling distribution of the sample means
iii.
Expert Solution
This question has been solved!
Explore an expertly crafted, step-by-step solution for a thorough understanding of key concepts.

Step by step
Solved in 4 steps with 3 images

Recommended textbooks for you
MATLAB: An Introduction with Applications
Statistics
ISBN:
9781119256830
Author:
Amos Gilat
Publisher:
John Wiley & Sons Inc

Probability and Statistics for Engineering and th…
Statistics
ISBN:
9781305251809
Author:
Jay L. Devore
Publisher:
Cengage Learning

Statistics for The Behavioral Sciences (MindTap C…
Statistics
ISBN:
9781305504912
Author:
Frederick J Gravetter, Larry B. Wallnau
Publisher:
Cengage Learning
MATLAB: An Introduction with Applications
Statistics
ISBN:
9781119256830
Author:
Amos Gilat
Publisher:
John Wiley & Sons Inc
Probability and Statistics for Engineering and th…
Statistics
ISBN:
9781305251809
Author:
Jay L. Devore
Publisher:
Cengage Learning
Statistics for The Behavioral Sciences (MindTap C…
Statistics
ISBN:
9781305504912
Author:
Frederick J Gravetter, Larry B. Wallnau
Publisher:
Cengage Learning

Elementary Statistics: Picturing the World (7th E…
Statistics
ISBN:
9780134683416
Author:
Ron Larson, Betsy Farber
Publisher:
PEARSON

The Basic Practice of Statistics
Statistics
ISBN:
9781319042578
Author:
David S. Moore, William I. Notz, Michael A. Fligner
Publisher:
W. H. Freeman

Introduction to the Practice of Statistics
Statistics
ISBN:
9781319013387
Author:
David S. Moore, George P. McCabe, Bruce A. Craig
Publisher:
W. H. Freeman