4. QUESTION 
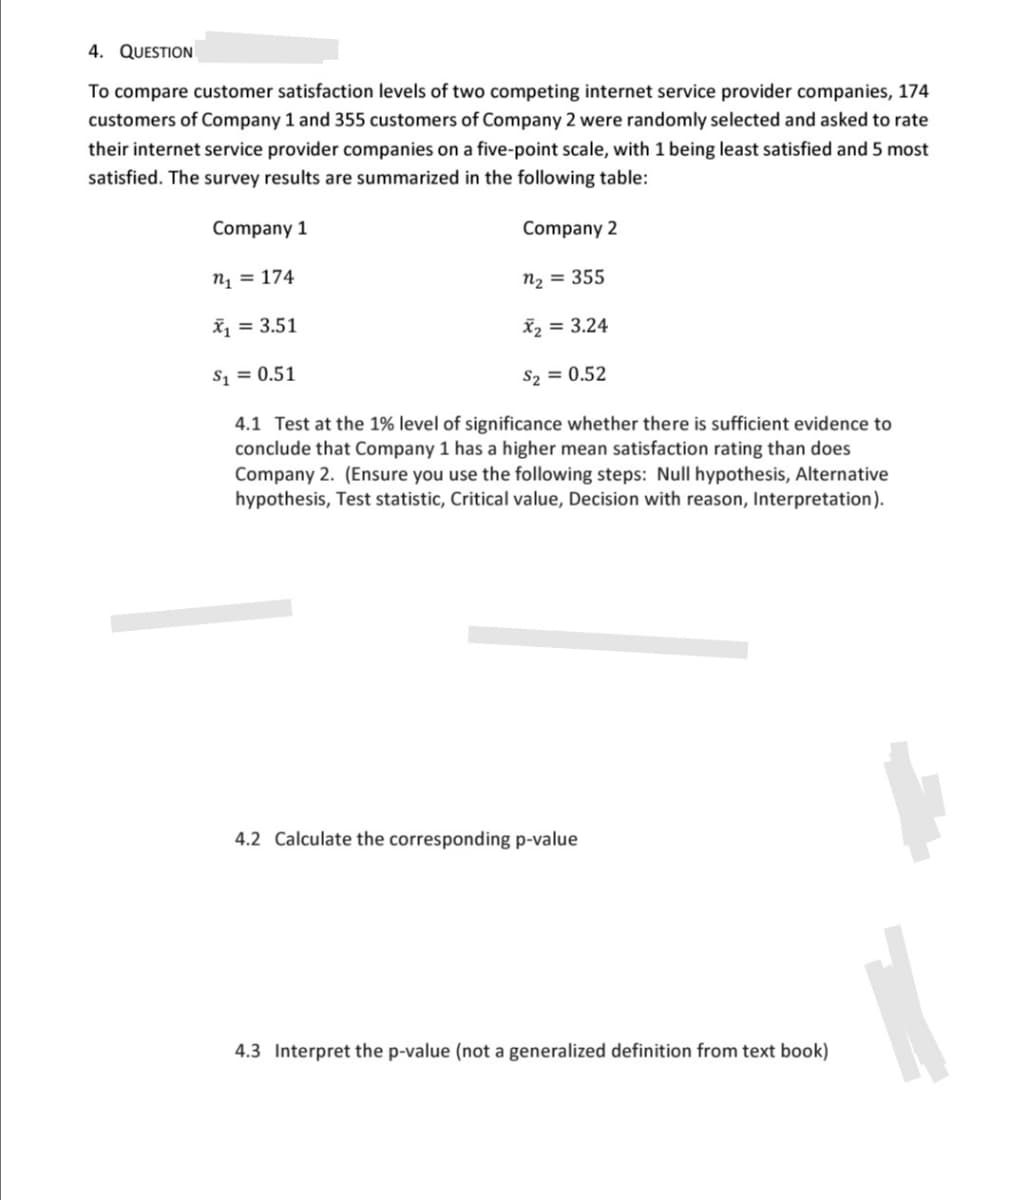
To compare customer satisfaction levels of two competing internet service provider companies, 174 customers of Company 1 and 355 customers of Company 2 were randomly selected and asked to rate their internet service provider companies on a five-point scale, with 1 being least satisfied and 5 most satisfied. The survey results are summarized in the following table: Company 1 Company 2 n = 174 n2 = 355 x, = 3.51 X2 = 3.24 S1 = 0.51 S2 = 0.52 4.1 Test at the 1% level of significance whether there is sufficient evidence to conclude that Company 1 has a higher mean satisfaction rating than does Company 2. (Ensure you use the following steps: Null hypothesis, Alternative hypothesis, Test statistic, Critical value, Decision with reason, Interpretation). 4.2 Calculate the corresponding p-value
Q: Electric motors are assembled on four different production lines. Random samples of motors are taken…
A: State the test hypotheses. Null hypothesis: H0: The failure rates do not differ among four lines.…
Q: In 2014, the Center for Disease Control and Prevention (CDC) published results from their National…
A: We have some data about the circulatory diseases among American adults, According to age group. Data…
Q: 5. A teacher argues any relationship between student success and the level of class participation…
A:
Q: In 1945, an organization surveyed 1100 adults and asked, "Are you a total abstainer from, or do…
A: Given α=0.05 n1=1100 (for recent survey)n2=1100 (for in 1945 survey) x1…
Q: n a certain school district, it was observed that 27% of the students in the element schools were…
A:
Q: Laveist and Nuru-Jeter (A-4) conducted a study to determine if doctor–patient race concordance was…
A: *Answer:
Q: Suppose Diana, an educational researcher at a local university, wants to test the impact of a new…
A: Diana selects a simple random sample of 68 freshmen and divides them into 34 pairs. we have given,…
Q: In a study of teen cell phone use, 117 high school students were observed as they drove out of their…
A: Solution Given out of 117 students drive their vehicles to school and 46 were taking on their…
Q: 5.The following table summarized the age and blood pressure status of 474 randomly selected Canadian…
A: O E (O-E)^2 (O-E)^2/E 23 30.39241 54.64765 1.798069 48 47.96624 0.001139 0.000024 27 19.64135…
Q: phosphate mine workers who had 30-89 WLM of exposure, and 60 phosphate mine workers who had 90-120…
A: The question is about chi square test . Given :
Q: In a certain school district, it was observed that 31% of the students in the element schools were…
A: From the given informations: 1. The hypothesized population proportion for the tes will be: H0:…
Q: Monthly salary computations from two different clothing companies yielded the following data: n1 =…
A: Given that n1 =7 Sample size n2=7 x1 =9130 Sample mean x2=8840 s1=386 Sample standard…
Q: (a) From the sample of 175 branches summarized above: (i) What proportion of branches are…
A:
Q: 1. Sarah wants to know how gender impacts heart rate recovery after a maximal exercise test. In…
A: 1. Sarah wants to know how gender impacts heart rate recovery after a maximal exercise test. In…
Q: There is a looming crisis in universities and colleges across North America. In most places…
A: Given information: Use the filter function from the excel to determine the number of professors who…
Q: As part of a study on transportation safety, the U.S. Department of Transportation collected data on…
A: Hello! As you have posted more than 3 sub parts, we are answering the first 3 sub-parts. In case…
Q: In a certain school district, it was observed that 29% of the students in the element schools were…
A:
Q: In 1949, an organization surveyed 1100 adults and asked, "Are you a total abstainer from, or do you…
A: Given: n1=1100x1=374p1=0.34n2=1100x2=330p2=0.30
Q: In a certain school district, it was observed that 34% of the students in the element schools were…
A: Here, the claim of the test is that the proportion of only children in the special program is…
Q: Suppose that data are collected from a random sample of 48 male students and 91 female students at a…
A:
Q: A researcher is conducting a study to investigate the relationship between students of Bachelor of…
A: i) Here population under is students of Bachelor of Business Management from the faculty of Business…
Q: 2. The manager of XXX Supermarket is making a study of the amounts customers spend in the…
A:
Q: A problem with a phone line that prevents a customer from receiving or making calls is upsetting to…
A: Since you have posted a question with multiple sub-parts, we will solve first three sub- parts for…
Q: You are conducting a study to see if the proportion of voters who prefer the Democratic candidate is…
A: given information: let us consider x : potential voters prefers the democratic candidate.…
Q: Do certain car colors attract the attention of the police more than others, so that they are more…
A: The observed frequencies are 16, 33, 39 and 32.
Q: The objective of a community research project is to determine whether women are more community…
A: a) Significance level is 0.05. n = 9 D.F = n - 1 D.F = 9 - 1 D.F = 8 Determine the critical value…
Q: a certain school district, it was observed that 29% of the students in the element schools were…
A: Given: Population proportion (p)= 29% = 0.29 Number of students (n) = 346 Level of significance =…
Q: uppose we wanted to test whether or not the average statistics score of two selected departments of…
A: Solution: n1=7 Sample size of agriculture department n2= 9 Sample size of BCH department…
Q: A problem with a phone line that prevents a customer from receiving or making calls is upsetting to…
A: Solution Given data West Office East Office 1.52 4.55 1.75 3.75 0.78 0.10 2.85 1.10…
Q: In a certain school district, it was observed that 29% of the students in the element schools were…
A:
Q: An anger-management course claims that, after completing its seminar, participants will lose their…
A: From the provided information, Sample size (n) = 12 Level of significance (α) = 0.02
Q: sample of 180 hypertension NON MODERATE HEAVY…
A: Given Information: 1) 2)
Q: 5. ATV Manufacturing Company is interested to know the differences between its two major outlet…
A: Given :
Q: As part of a study on transportation safety, the U.S. Department of Transportation collected data on…
A:
Q: An experiment was performed to attempt to answer the question posed in Question 12. In the…
A: Given 95% CI for μsplit- μindividual is ($5.59,$21.67)
Q: The director of advertising for the Carolina Sun Times, the largest newspaper in the Carolinas, is…
A: Solution: The given table of data is
Q: Suppose we have the following data collected from three randomly-selected counties 1.How many…
A: Given: Sample size n = 3 Formula Used: Degree of freedom = n-2 Correlation coefficient r =…
Q: A government agency computed the proportion of U.S. residents who lived in each of four geographic…
A: Claim : The proportions of people living in the various regions changed between the current year and…
Q: Example 3. A survey company investigated 800 car owners and found, 65- owned Maruti car and 300…
A:
Q: Do single-parent families tend to be more impoverished than familics with two parents? In to test if…
A: Given table data is as below, col1 col2 totals row1 24 20 44 row2 11 45 56 totals 35 65…
Q: Carry out a hypothesis test for a significant difference between the two population proportions, at…
A:
Q: Laveist and Nuru-Jeter (A-4) conducted a study to determine if doctor–patient race concordance was…
A: *Answer:
Q: c please survey of 1000 adults from a certain region asked, "If purchasing a used car made…
A: Identify the correct options for the blanks of the confidence interval obtained. The correct…
Q: A market research group is interested in estimating the market share of three airline companies, A,…
A: Hypotheses: a) H0: p1 = 0.25, p2 = 0.5, p3 = 0.25 versus Ha: at least one p is not as specified…
Q: To compare the customer satisfaction levels of two competing companies, 174 customers of company 1…
A: Hi! Thank you for the question as per the honour code, we’ll answer the first question since the…
Q: In a certain school district, it was observed that 28% of the students in the element schools were…
A: Given information- Sample size, n = 184 Significance level, α = 0.02 We have given that 64 out of…
Q: In 2015, Addison Group and Kelton surveyed the work preferences and attitudes of 1047 working adults…
A: In this context, the aim is to test whether the interest in leaving a current job for more money is…
Q: According to the NIMH website the average number of adult Americans diagnosed with a “serious mental…
A: Note: "Since you have posted a question with multiple sub-parts, we will solve the first three…
Q: Is there evidence of a difference between males and females in the proportion who said they prefer…
A:
Trending now
This is a popular solution!
Step by step
Solved in 3 steps with 3 images
- In a survey of families in which both parents work, one of the questions asked was, “Have you refused a job, promotion, or transfer because it would mean less time with your family?” A total of 200 men and 200 women were asked this question. “Yes” was the response given by 29% of the men and 24% of the women. Based on this survey, can we conclude that there is a difference in the proportion of men and women responding “yes” at the 0.05 level of significance?A researcher is studying two types of medication that both treat hives. 23 out of the random sample of 334 adults given medication A still had hives 30 minutes after taking the medication. 18 out of another random sample of 346 adults given medication B still had hives 30 minutes after taking the medication. Test to see if the proportion of people who still had hives after medicine A is different than the proportion of people who still had hives after medicine B. Use a 0.01 level of significance.A poll asked 946 adults "If purchasing a used car made certain upgrades or features more affordable, what would be your preferred luxury upgrade? The results indicated that 8% of the males and 17% of the females answered window tinting. The poll description did not state the sample sizes of males and females. Suppose that both sample sizes were 473 and that 40 of 473 males and 80 of 473 females reported window tinting as their preferred luxury upgrade of choice. b. Find the p-value in (a) and interpret its meaning. The p-value is _______ (Round to three decimal places as needed.) Interpret the p-value. The p-value is the probability that in a random sample of 946 adults, the difference between the proportions of males and females who said they prefer window tinting as a luxury upgrade will be _________the difference in this sample, assuming that the proportion of males who said they prefer window tinting as a luxury upgrade is ________the proportion for females…
- Suppose that two brands of gasoline were being compared for mileage. Samples of each brand were used in identical cars under identical conditions. Nine tests were made of Brand I and six tests of Brand II. Are the two brands significantly different? What test is most appropriate?A sociologist wants to investigate the question, "Is there a relationship between texting during class and grade-point-average (GPA) among high school seniors in a large district?" Which study design is most appropriate? Before the semester starts, randomly select 40 seniors from each high school who do not text during class. Assign 20 to the texting treatment group (text three or more times during every class meeting) and 20 to the control group (no texting during class). At the end of the semester, obtain each student’s GPA from the appropriate admissions and records office. Compare the GPA of students who routinely text during class to the GPA of students who do not text during class. Before the semester starts, randomly select 40 seniors from each high school who do not text during class. Assign 20 to the texting treatment group (text three or more times during every class meeting) and 20 to the control group (no texting during class). At the end of the semester,…A poll asked 946 adults "If purchasing a used car made certain upgrades or features more affordable, what would be your preferred luxury upgrade? The results indicated that 8% of the males and 17% of the females answered window tinting. The poll description did not state the sample sizes of males and females. Suppose that both sample sizes were 473 and that 40 of 473 males and 80 of 473 females reported window tinting as their preferred luxury upgrade of choice. a. Is there evidence of a difference between males and females in the proportion who said they prefer window tinting as a luxury upgrade at the 0.01 level of significance? Let group 1 be the males, and let group 2 be the females. State the null and alternative hypotheses. Choose the correct answer below. A. H0: π1≥π2 H1: π1<π2 B. H0: π1≤π2 H1: π1>π2 C. H0: π1<π2 H1: π1≥π2 D. H0: π1=π2 H1: π1≠π2 E. H0: π1≠π2 H1: π1=π2 F. H0: π1>π2…
- 4. A researcher claims that the percentage of infants who receiveimmunizations is less than 80%. She selects a sample of size 750 infantsand 573 have received immunizations. At a 5 % significance level, what conclusion should the researchersmake?In a random survey of 1500 adults in California and 1000 in Oregon, you find that percentage of smokers is 15.2% and 18.5% respectively. At a 1% significance level, is there enough evidence to conclude that the proportion of adults who are smokers is lower in California than in Oregon? (Show hand calculations)Suppose we take a sample of 2,500 blood donors from a population for which 50% (0.5) have type O+ blood. (a) Into what range of possible values should the sample proportion fall 95% of the time, according to the Empirical Rule? to (b) If the sample included only 625 donors instead of 2,500, would the range of possible sample proportions be wider, more narrow, or the same as with a sample of 2,500 donors? Explain your answer, and explain why it makes intuitive sense. The range would be with 625 donors compared to a sample of 2,500 donors since the standard deviation of the sampling distribution would be . This makes intuitive sense because if fewer donors are included in the sample, the proportion will be reliable as an estimate of the proportion.
- Using a theoretical framework from engineering sciences, the researcher believes that the physical set up of hospital rooms impacts rates of hand washing. After prolonged engagement, she observed the healthcare providers working on a medical/surgical floor of a hospital. As the result of her data analysis she purposefully selected 6 physicians, 10 nurses and 12 nursing aids to conducted in-depth interviews with. Subsequent to the analysis of that data she then purposefully selected 5 medical residents, 10 more nurses, the radiographers assigned to the portable imaging machine, and 15 patient transporters to conduct interviews with. She uses the data she collected and analyzed to develop a survey that she sent to 100 randomly selected hospitals across the northeast. What research design was used in this study? a. Mixed Methods b. Exploratory c. Convergent d. ExplanatoryA researcher is comparing the occurrence of nausea as a side-effect in two brands of medication: Brand A and Brand B. For a random sample of 150 Brand A users, 66 experienced nausea as a side-effect. For a random sample of 200 Brand B users, 118 experienced nausea as a side-effect. Can the researcher conclude that the proportion of all Brand A users who experience nausea as a side-effect is different from the proportion of all Brand B users who experience nausea as a side-effect. For the hypothesis testing scenario above, the researcher concludes that the two proportions are different at the 0.01 significance level. Compute the 99% confidence interval to estimate the difference.According to the February 2008 Federal Trade Commission report on consumerfraud and identity theft, 23% of all complaints in 2007 were for identity theft. Inthat year, Arkansas had 1,601 complaints of identity theft out of 3,482 consumercomplaints ("Consumer fraud and," 2008). Does this data provide enoughevidence to show that Arkansas had a higher proportion of identity theft than23%? Test at the 5% level.