4. Review the table and consider questions such as the following. Needs Origin / Rating Poor Satisfactory V Good Excellent Total Improvement External 0% 2% 12% 19% 9% 42% Internal 4% 8% 15% 23% 8% 58% Grand Total 4% 10% 27% 42% 17% 100% 1. What percentage of the employees originated from within the organization? 2. What percentage of the employees are both internal and rated 'Very Good'? 3. What percentage of the employees received 'Needs Improvement' or 'Poor'? 4. What category contains the greatest number of employees?
4. Review the table and consider questions such as the following. Needs Origin / Rating Poor Satisfactory V Good Excellent Total Improvement External 0% 2% 12% 19% 9% 42% Internal 4% 8% 15% 23% 8% 58% Grand Total 4% 10% 27% 42% 17% 100% 1. What percentage of the employees originated from within the organization? 2. What percentage of the employees are both internal and rated 'Very Good'? 3. What percentage of the employees received 'Needs Improvement' or 'Poor'? 4. What category contains the greatest number of employees?

Glencoe Algebra 1, Student Edition, 9780079039897, 0079039898, 2018
18th Edition
ISBN:9780079039897
Author:Carter
Publisher:Carter
Chapter10: Statistics
Section10.6: Summarizing Categorical Data
Problem 4BGP

Related questions
Question
100%
do not answer number 3, only number 4
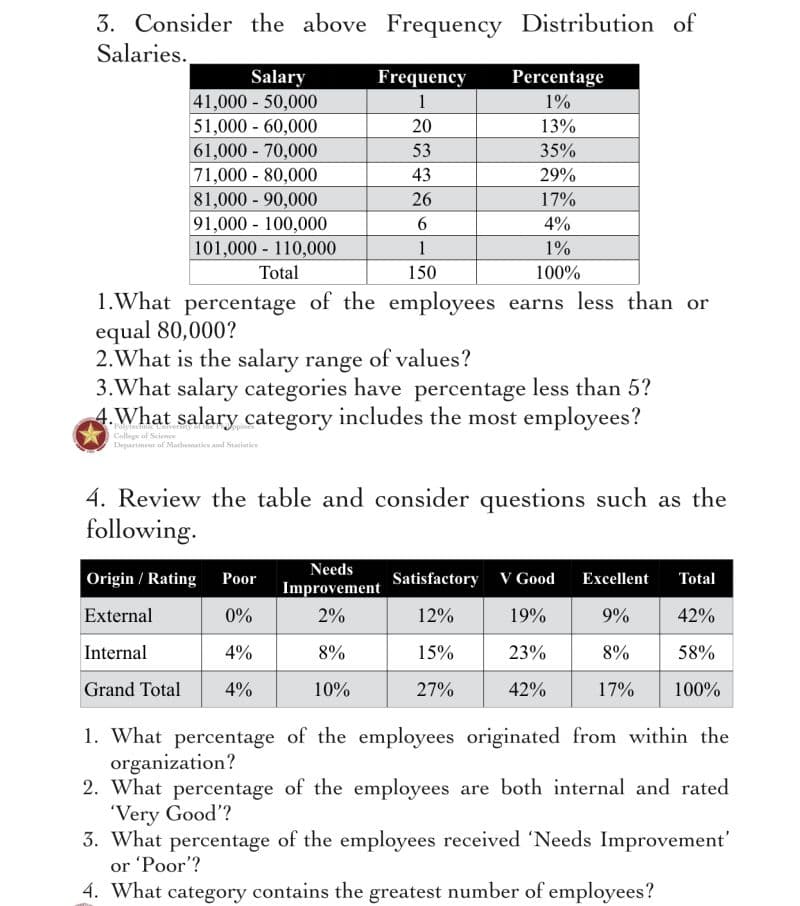
Transcribed Image Text:3. Consider the above Frequency Distribution of
Salaries.
Salary
41,000 50,000
51,000 60,000
61,000-70,000
71,000 80,000
Frequency
Percentage
1
1%
20
13%
53
35%
43
29%
81,000 - 90,000
91,000 100,000
101,000 110,000
26
17%
4%
1
1%
Total
150
100%
1.What percentage of the employees earns less than or
equal 80,000?
2.What is the salary range of values?
3.What salary categories have percentage less than 5?
4.What salary category includes the most employees?
Callege af Science
Department of Machematies and Stariutics
4. Review the table and consider questions such as the
following.
Needs
Origin / Rating Poor
Satisfactory v Good
Excellent
Total
Improvement
External
0%
2%
12%
19%
9%
42%
Internal
4%
8%
15%
23%
8%
58%
Grand Total
4%
10%
27%
42%
17%
100%
1. What percentage of the employees originated from within the
organization?
2. What percentage of the employees are both internal and rated
'Very Good'?
3. What percentage of the employees received 'Needs Improvement'
or 'Poor'?
4. What category contains the greatest number of employees?
Expert Solution
This question has been solved!
Explore an expertly crafted, step-by-step solution for a thorough understanding of key concepts.

This is a popular solution!

Trending now
This is a popular solution!

Step by step
Solved in 2 steps

Recommended textbooks for you
Glencoe Algebra 1, Student Edition, 9780079039897…
Algebra
ISBN:
9780079039897
Author:
Carter
Publisher:
McGraw Hill
Glencoe Algebra 1, Student Edition, 9780079039897…
Algebra
ISBN:
9780079039897
Author:
Carter
Publisher:
McGraw Hill